Last updated: 2026-03-29
Agent Jobs Manager
The first cross-platform GUI for SQL Server Agent. Browse jobs, view execution history, run and stop jobs, and manage operators, alerts, proxies, and error logs — all from macOS, Windows, or Linux.
Getting Started
The Agent Jobs Manager gives DBAs a modern interface for SQL Server Agent — the built-in job scheduler in SQL Server. Use it to monitor scheduled jobs, investigate failures, create new jobs, and manage the full Agent ecosystem (operators, alerts, proxies, error logs).
Requirements
- SQL Server Standard, Enterprise, or Developer edition — Express Edition does not include SQL Server Agent
- SQL Server Agent must be running — the Agent service needs to be started on the server
- Permissions — you need at least
SQLAgentReaderRolein msdb to view jobs;SQLAgentOperatorRoleorsysadminto run, create, or modify jobs
How to Open the Agent Jobs Manager
- Connect to a SQL Server instance in Jam SQL Studio
- Click the Job Scheduler button in the main toolbar (or use the Command Palette: Cmd+Shift+P → "Job Scheduler")
- Alternatively, expand the SQL Server Agent node in the Object Explorer and right-click the Jobs folder
- The dashboard loads automatically, showing all jobs with their current status
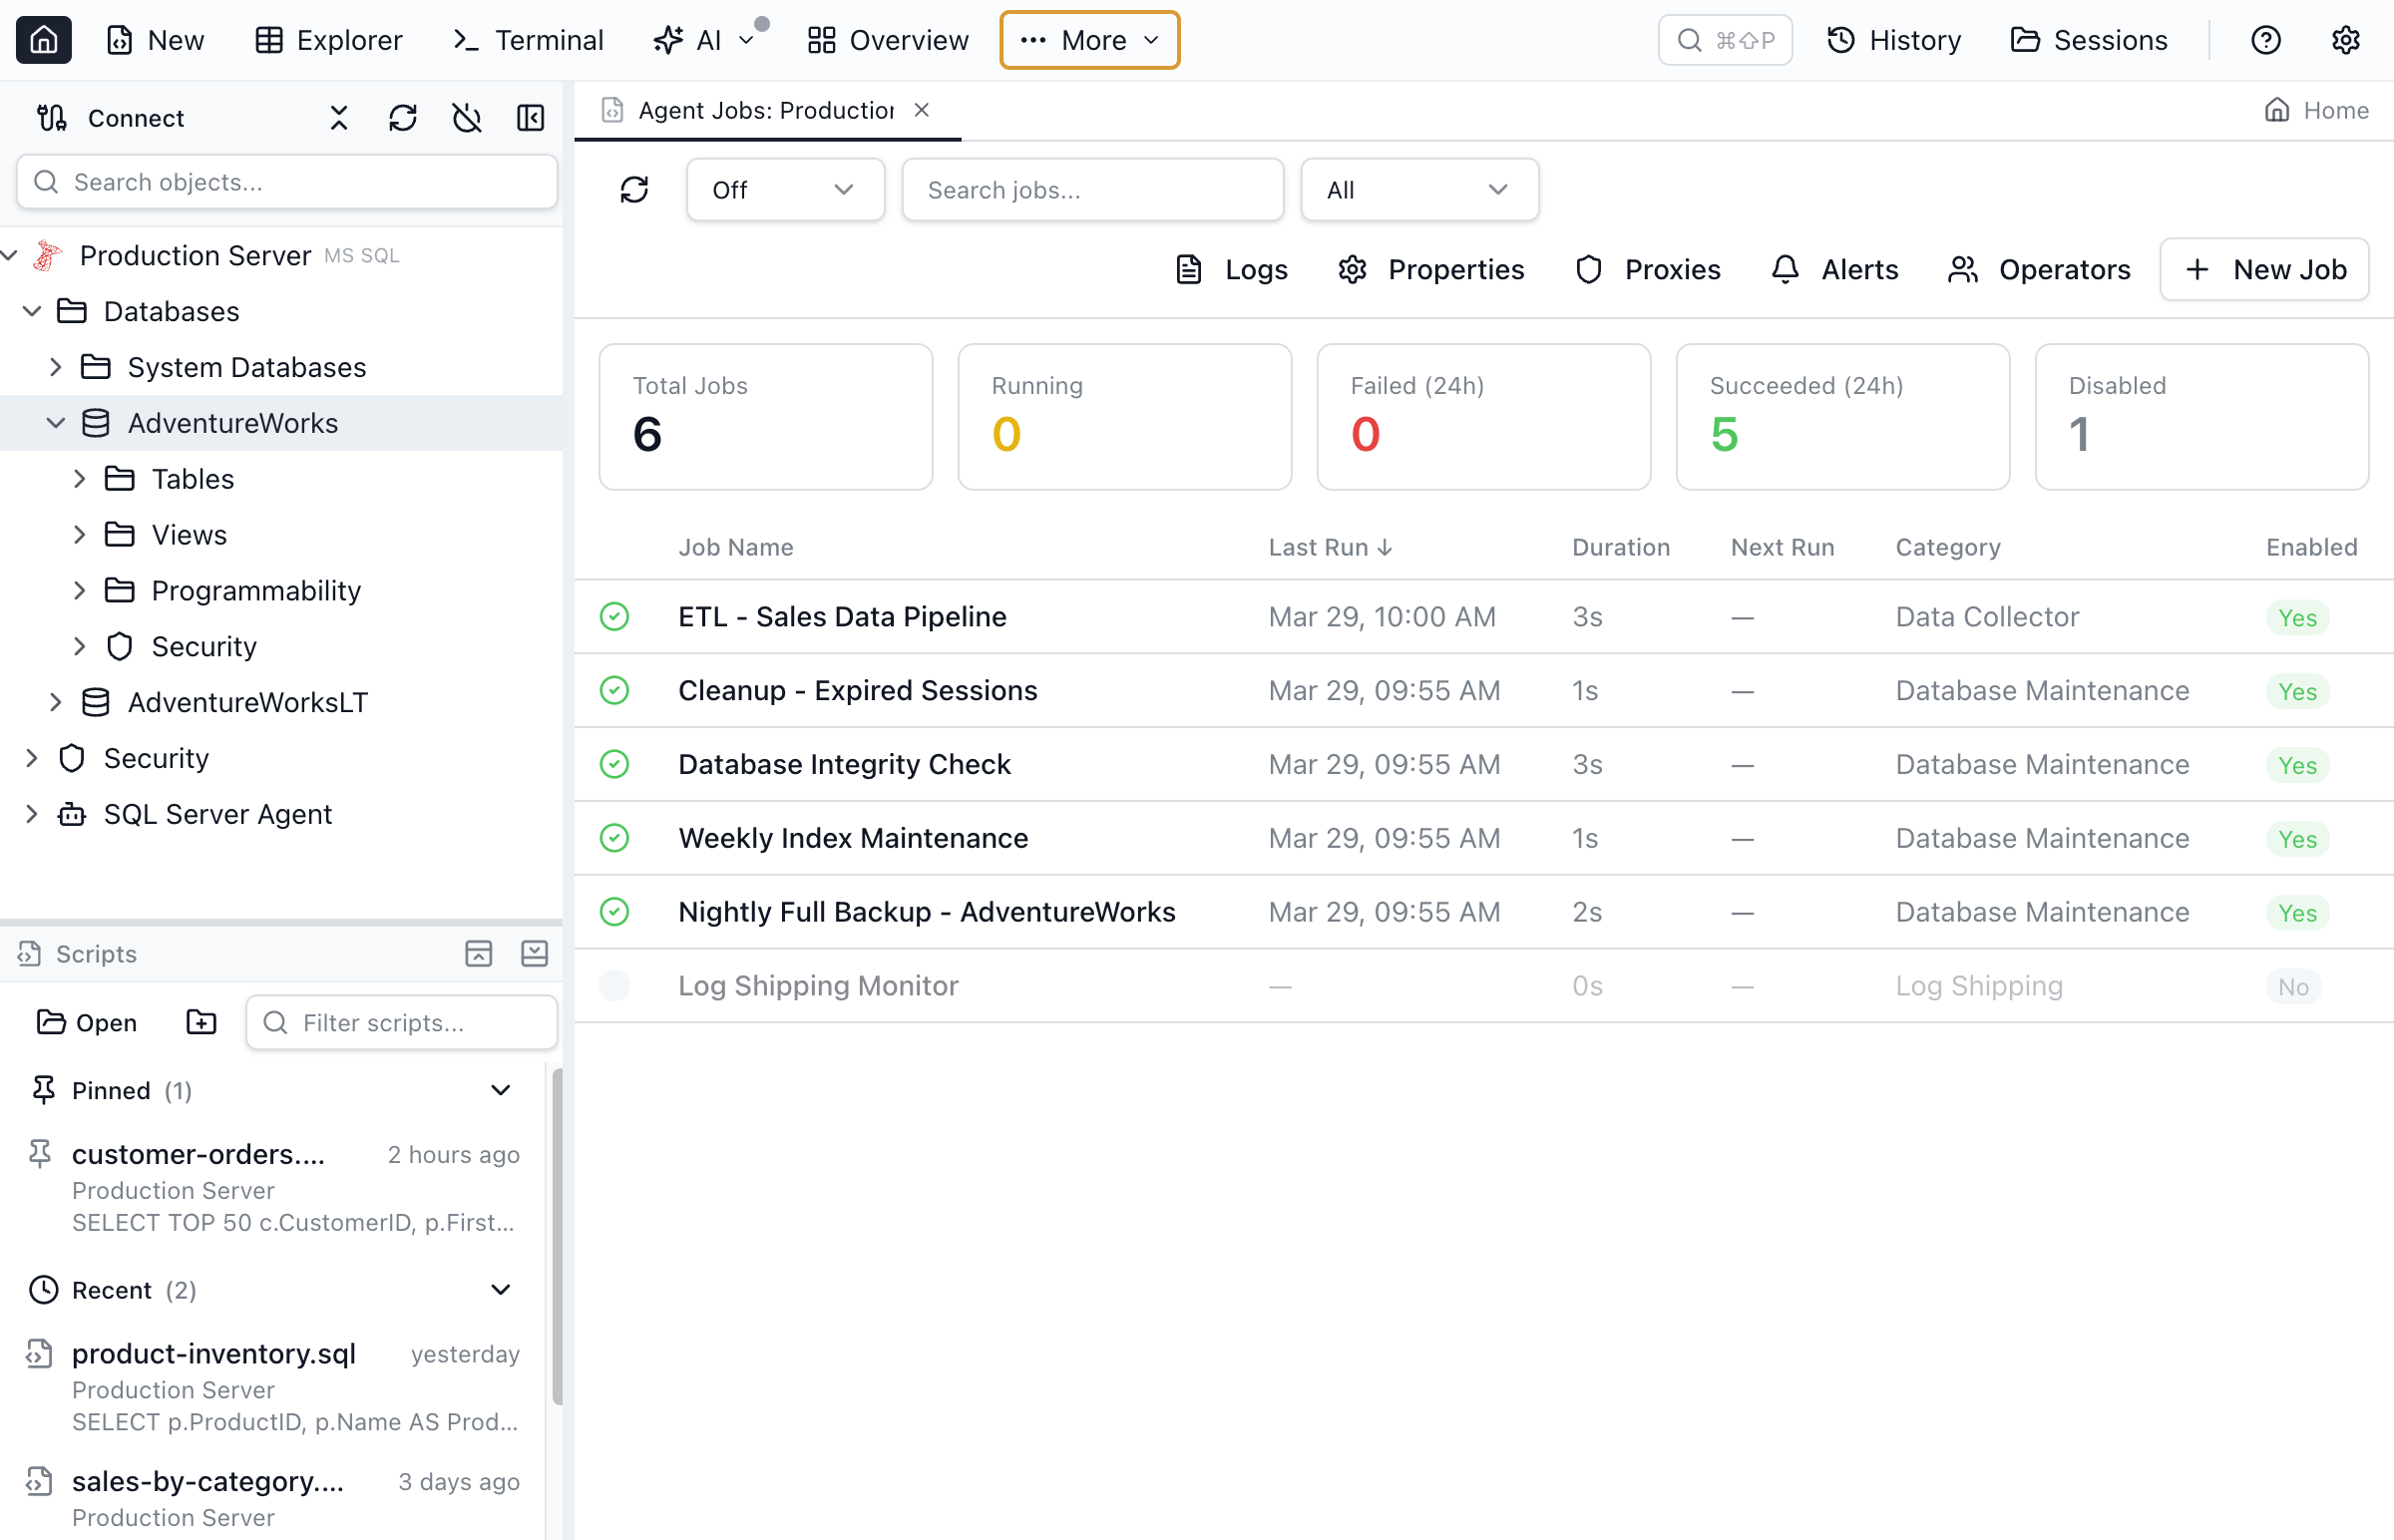
Jobs Dashboard
The main view shows all Agent jobs in a sortable grid with key information at a glance:
- Name — the job name
- Enabled — whether the job is active
- Status — current execution status (Idle, Executing, Waiting for step, etc.)
- Last Run — timestamp and outcome of the most recent execution
- Next Run — when the job is scheduled to run next
- Category — the job category (e.g., Database Maintenance, Data Collector)
Click any column header to sort. The toolbar provides Refresh and Auto-Refresh controls for real-time monitoring.
Summary Cards
Above the grid, summary cards show at-a-glance metrics: total jobs, enabled jobs, running jobs, and failed jobs. These update on every refresh cycle.
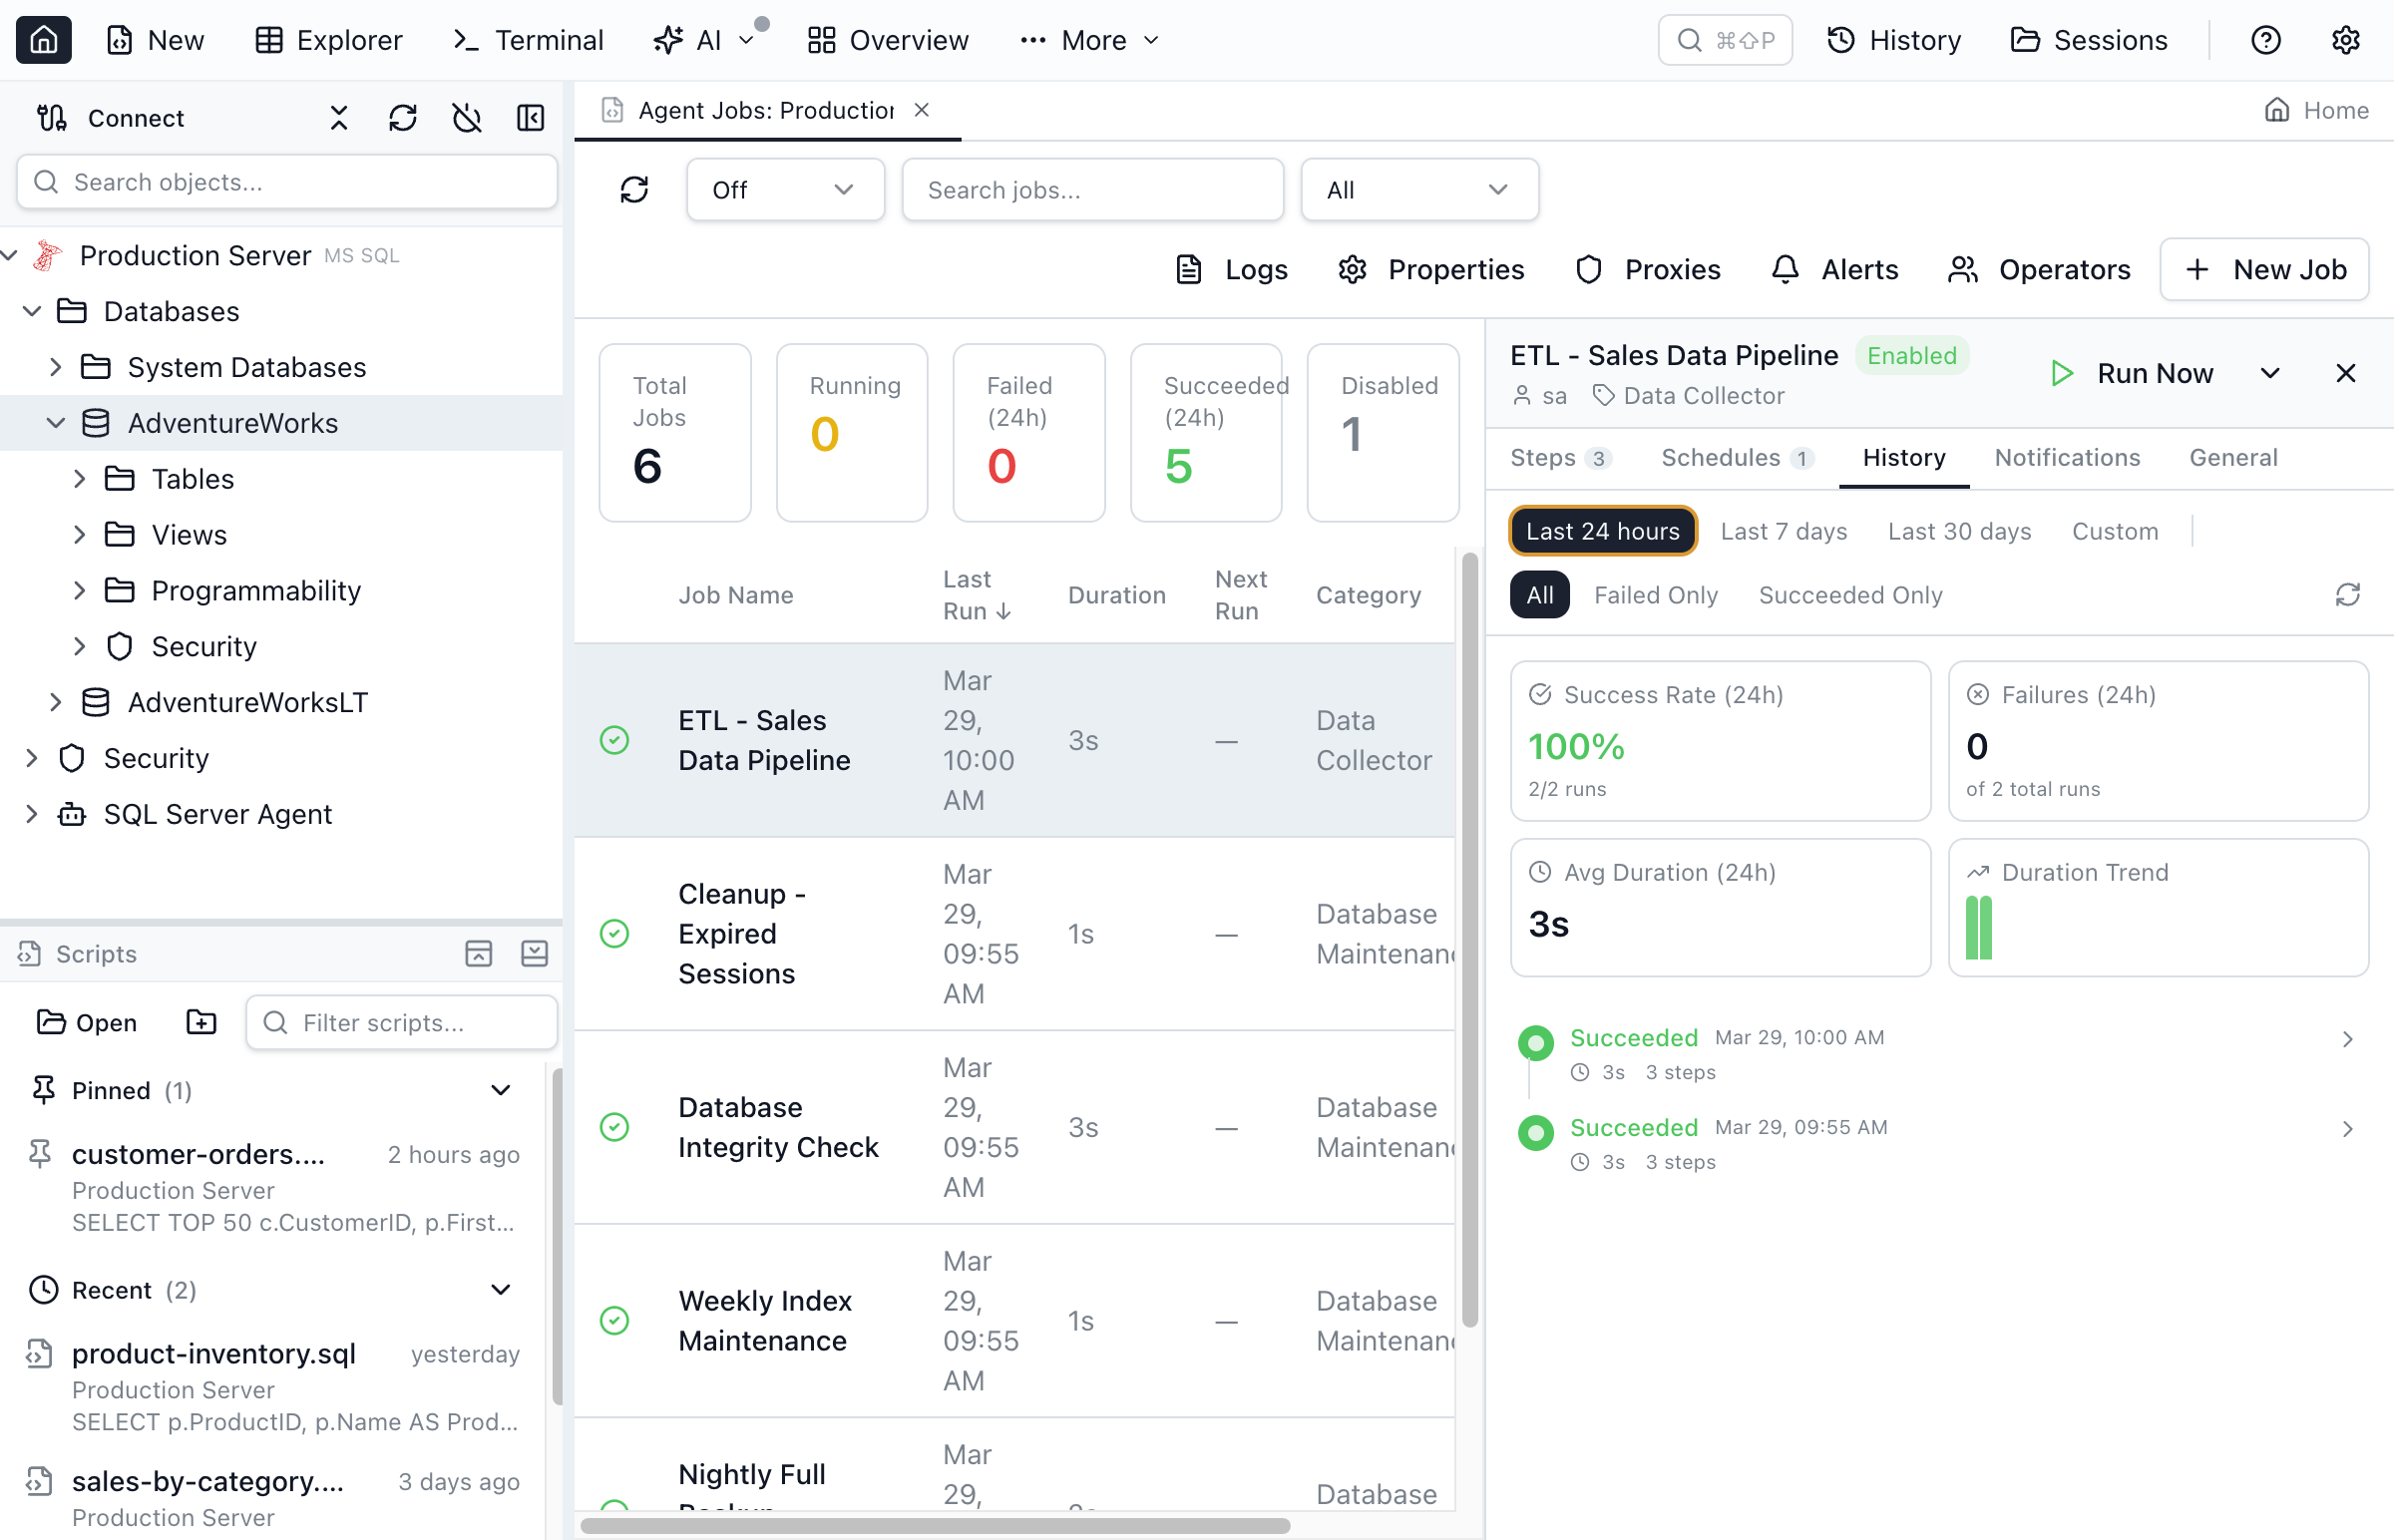
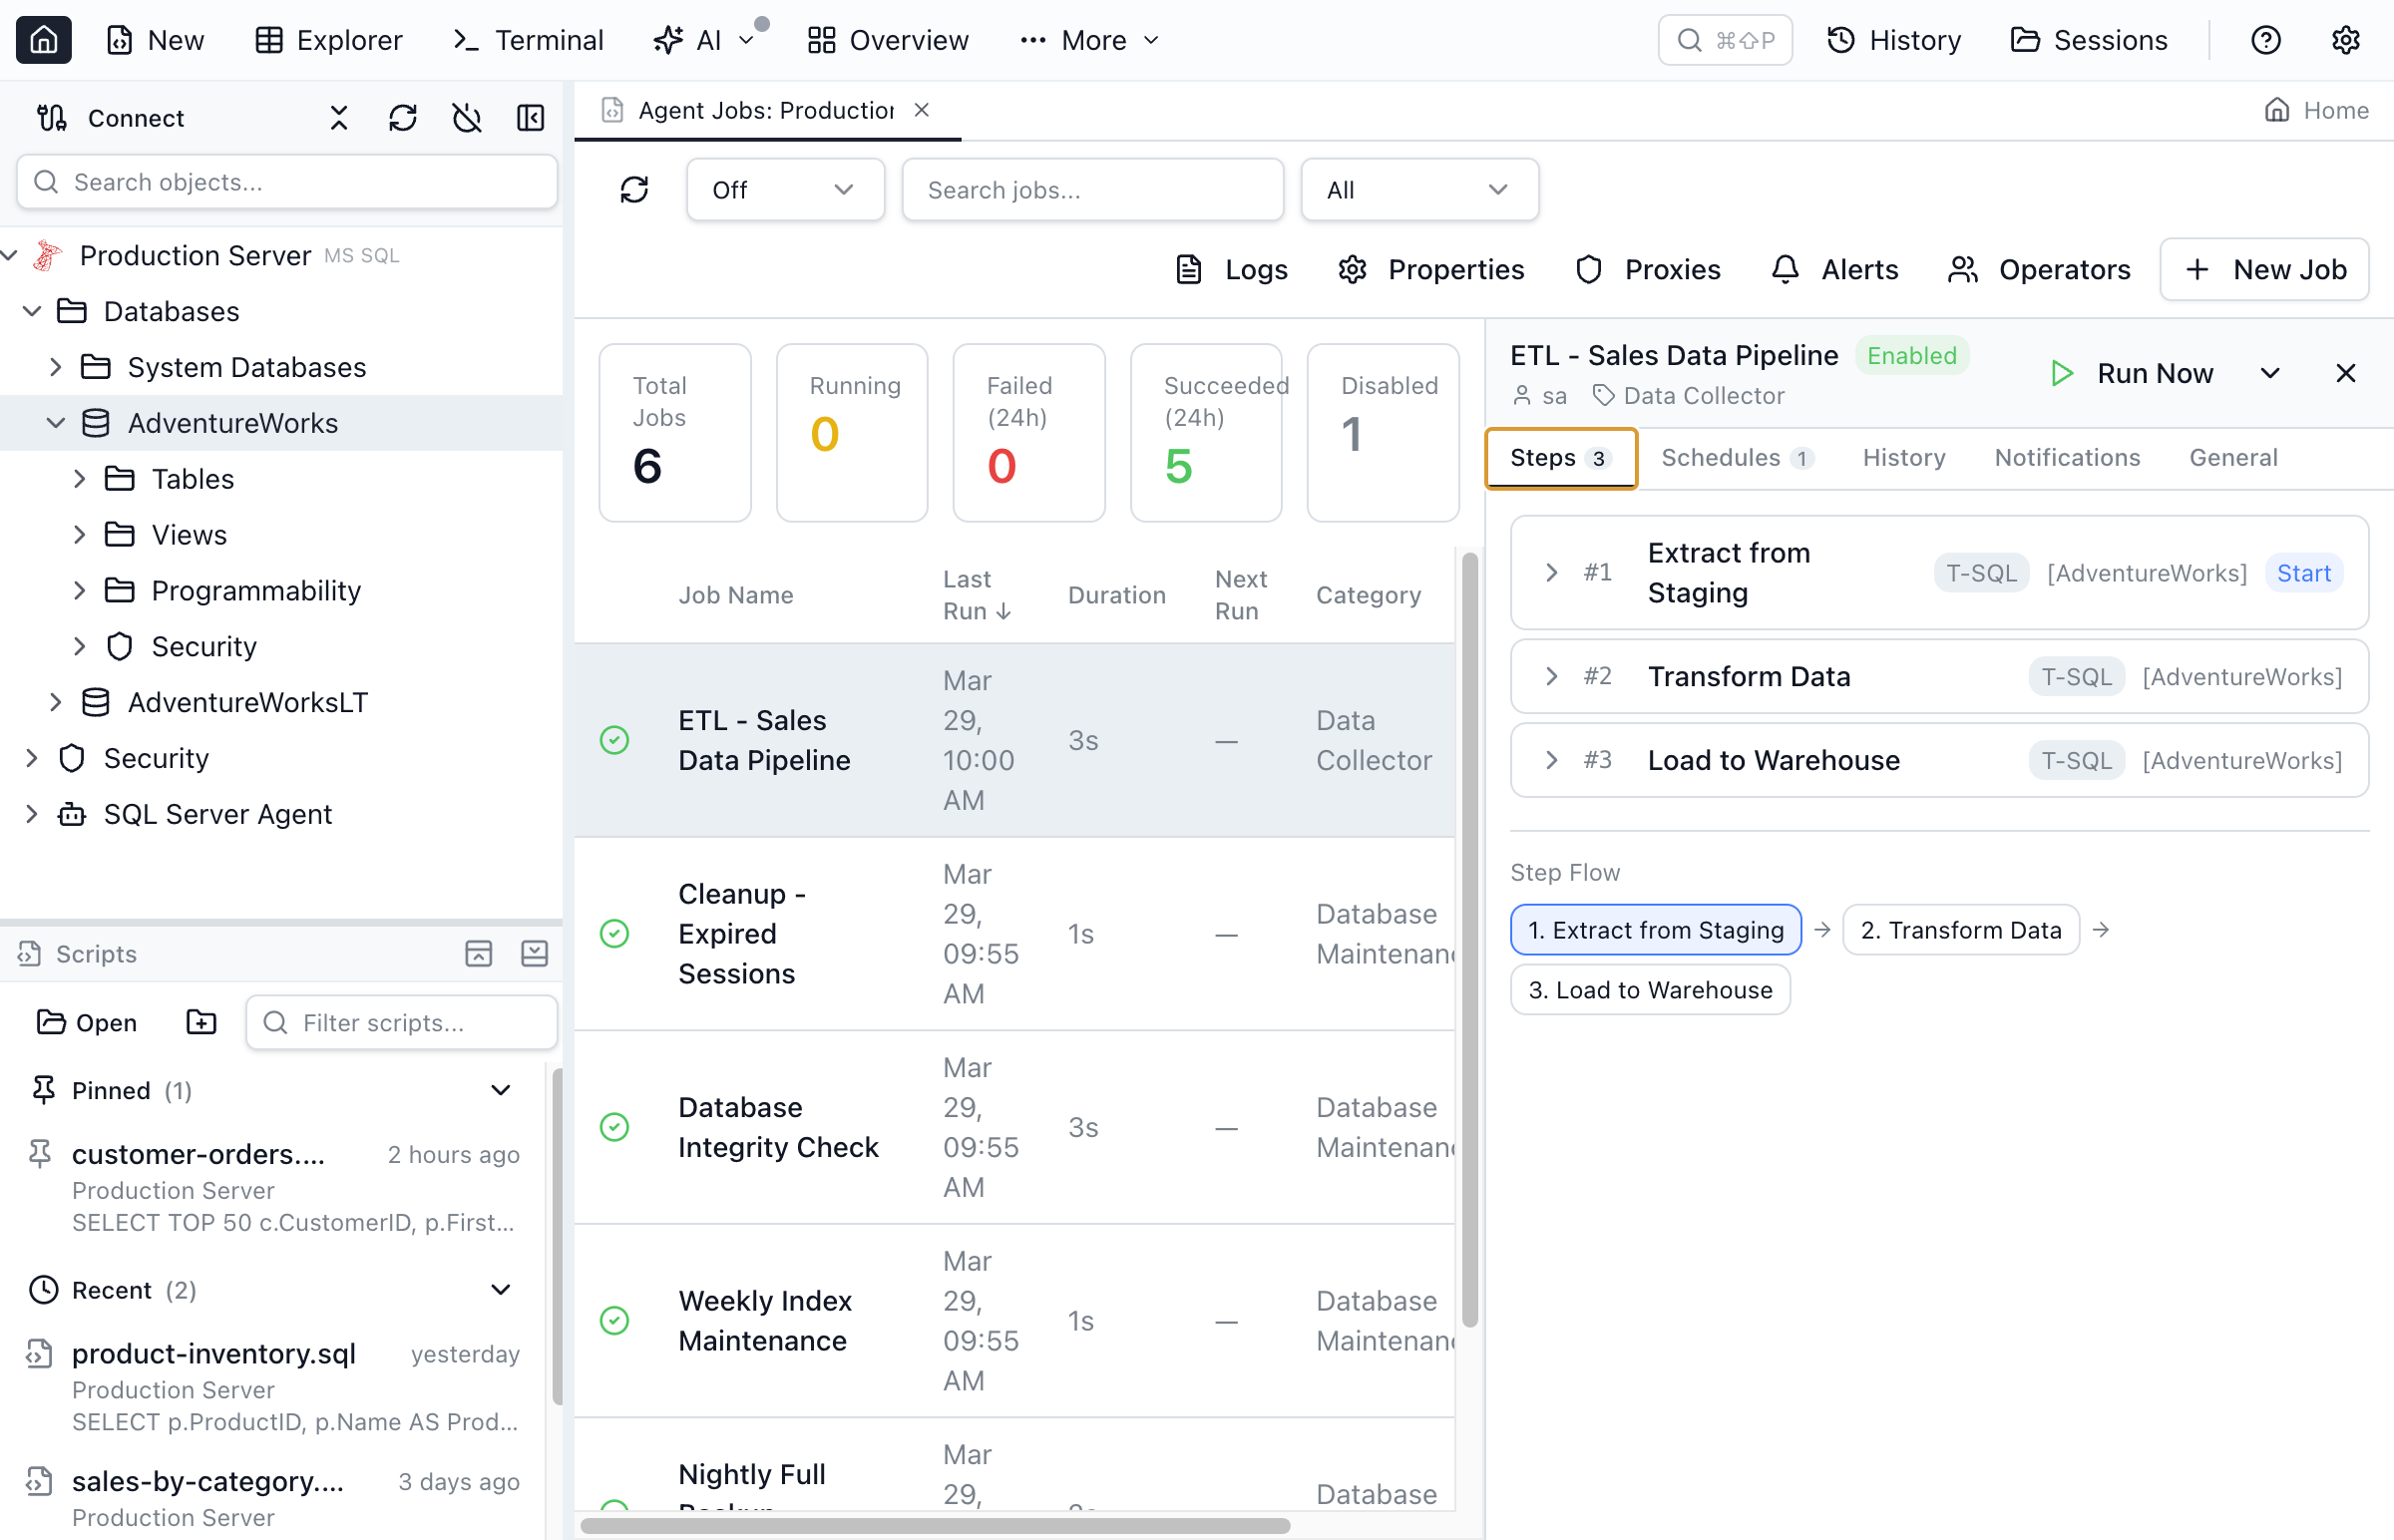
Job Detail
Click a job row to open the detail panel on the right side. The detail view has five tabs:
Steps Tab
Shows the ordered list of job steps with their subsystem type (T-SQL, CmdExec, PowerShell, SSIS, etc.), the command text, and the on-success / on-failure flow. Steps are displayed with their execution order and flow logic so you can understand the job's branching behavior.
Schedules Tab
Lists all schedules attached to the job with decoded frequency descriptions. For example, a schedule might show "Occurs every 1 week(s) on Monday, Wednesday, Friday at 02:00:00" — fully decoded from the raw frequency integers stored in msdb.dbo.sysschedules.
History Tab
A visual timeline of job execution history. Each run shows the start time, duration, and outcome (Succeeded, Failed, Retried, Cancelled). Click a run to expand its step-by-step breakdown with individual step durations and error messages for failed steps.
Filter history by:
- Date range — Last 24 hours, 7 days, or 30 days
- Status — All, Failed only, or Succeeded only
Summary statistics at the top show the success rate, failure count, average duration, and a duration trend sparkline.
Notifications Tab
Shows the notification configuration for the job: which operators are notified on success, failure, or completion, and through which channels (email, pager, net send).
General Tab
Displays job metadata: owner, date created, date modified, description, and the job ID (GUID).
Running and Stopping Jobs
You can control job execution directly from the interface:
- Run Now — right-click a job and select Run Now, or click the Run button in the detail header
- Stop — stop a running job with a confirmation dialog showing the job name and warning about mid-execution termination
- Enable / Disable — toggle a job's enabled state from the context menu
While any job is running, the dashboard auto-refreshes every 2 seconds. Toast notifications confirm when jobs start, stop, or complete.
Creating and Editing Jobs
Click New Job in the toolbar to open the job editor, or right-click an existing job and select Edit.
General
Set the job name, owner, category, description, and enabled state.
Steps
Add, remove, and reorder job steps. Each step has:
- Step name — a descriptive label
- Subsystem — T-SQL, CmdExec, PowerShell, SSIS, Analysis Services, and more
- Command — the SQL or script to execute
- Database — the target database context (for T-SQL steps)
- On success / On failure — what happens next (go to next step, go to specific step, quit with success, quit with failure)
Schedules
Attach one or more schedules to the job. The schedule editor supports all SQL Server Agent frequency types:
- Once — a single execution at a specific date and time
- Daily — every N days at a set time
- Weekly — specific days of the week with a recurrence interval
- Monthly — specific day of the month
- Monthly relative — e.g., "the second Tuesday of every month"
- On Agent start — runs when SQL Server Agent starts
- On idle — runs when the server becomes idle
Notifications
Configure who gets notified and when: on success, failure, or completion. Select an operator and a notification method (email, pager, net send, or event log).
Script Preview
Before saving, click Preview Script to see the generated T-SQL. The script uses SQL Server Agent stored procedures (sp_add_job, sp_add_jobstep, sp_add_schedule, etc.) and can be copied to the clipboard for review or manual execution.
Operators
Operators are the notification contacts for SQL Server Agent. Navigate to the Operators view from the toolbar.
- Create operators with email address, pager email, pager schedule (days and hours), and net send address
- Edit operators — update contact information and enabled state
- View notifications — see which jobs and alerts notify each operator
- Delete operators with confirmation
Alerts
Alerts respond to SQL Server events, performance conditions, or WMI events. Navigate to the Alerts view from the toolbar.
Alert Types
- SQL Server event — triggered by a specific error number or severity level, optionally filtered to a specific database and message text pattern
- Performance condition — triggered when a performance counter crosses a threshold (e.g., "SQL Server:Locks — Lock Wait Time > 1000")
- WMI event — triggered by WMI event queries for advanced server monitoring
Alert Response
Each alert can execute a job and/or notify one or more operators. The Response tab lets you select a response job and configure operator notifications with method (email, pager, net send).
Alert Options
Configure delay between responses to prevent notification storms, and set the alert's enabled state.
Proxies
Proxy accounts let non-sysadmin users run job steps under a specific Windows credential. Navigate to the Proxies view from the toolbar.
- Create proxies — select a Windows credential and grant access to specific subsystems (T-SQL, CmdExec, PowerShell, SSIS, Analysis Services, etc.)
- Edit proxies — change credential, subsystem access, description, and enabled state
- Delete proxies with confirmation
The proxy editor shows checkboxes for all 12 SQL Server Agent subsystems, making it easy to see and modify which step types the proxy can execute.
Agent Properties
The Properties view shows a read-only summary of the SQL Server Agent configuration:
- Agent status — whether the Agent service is currently running
- Agent XPs enabled — whether the extended stored procedures are enabled
- Mail profile — the Database Mail profile used for notifications
- Fail-safe operator — the operator notified when the primary operator cannot be reached
Error Logs
The Error Logs view lets you browse SQL Server Agent error logs:
- Log selector — switch between the current log and up to 9 archived logs
- Text search — filter log entries by keyword
- Entry details — each entry shows the date, process info, and message text
Object Explorer Integration
The SQL Server Agent appears as a top-level node in the Object Explorer with sub-folders for Jobs, Operators, Alerts, and Proxies. Right-click the Jobs folder to open the Job Scheduler directly.
Key Capabilities
- Cross-platform SQL Server Agent GUI — the first tool to manage Agent jobs on macOS and Linux
- Jobs dashboard — browse all jobs with status, last run, next run, and category at a glance
- Visual history timeline — color-coded execution history with step-by-step drill-down
- Run and stop jobs — execute and control jobs with real-time status monitoring
- Full job editor — create and modify jobs with steps, schedules, and notifications
- Script preview — review generated T-SQL before applying changes
- Operators management — create and manage notification contacts with pager schedules
- Alerts management — configure event, performance, and WMI alerts with response actions
- Proxy accounts — manage security contexts for job steps with subsystem access control
- Agent properties and error logs — view Agent configuration and browse error logs
Ready to Manage SQL Server Agent?
Download Jam SQL Studio and start managing Agent jobs from any platform.