Last updated: 2026-04-12
Query Editor
Write, execute, and analyze SQL queries with Jam SQL Studio's powerful query editor. Get IntelliSense suggestions, view multiple result sets, analyze execution plans, edit results inline (UPDATE), and export results to various formats.
Writing Queries
The query editor provides a full-featured SQL editing experience with syntax highlighting and intelligent code completion.
IntelliSense and Autocomplete
As you type, Jam SQL Studio suggests relevant completions based on your database schema and SQL context:
- Table names - Suggested after FROM, JOIN, INSERT INTO, UPDATE
- Column names - Suggested after SELECT, WHERE, ORDER BY, or when typing after a table alias
- SQL keywords - Context-aware keyword suggestions (FROM after SELECT, WHERE after FROM, etc.)
- Functions - Built-in SQL functions with parameter hints
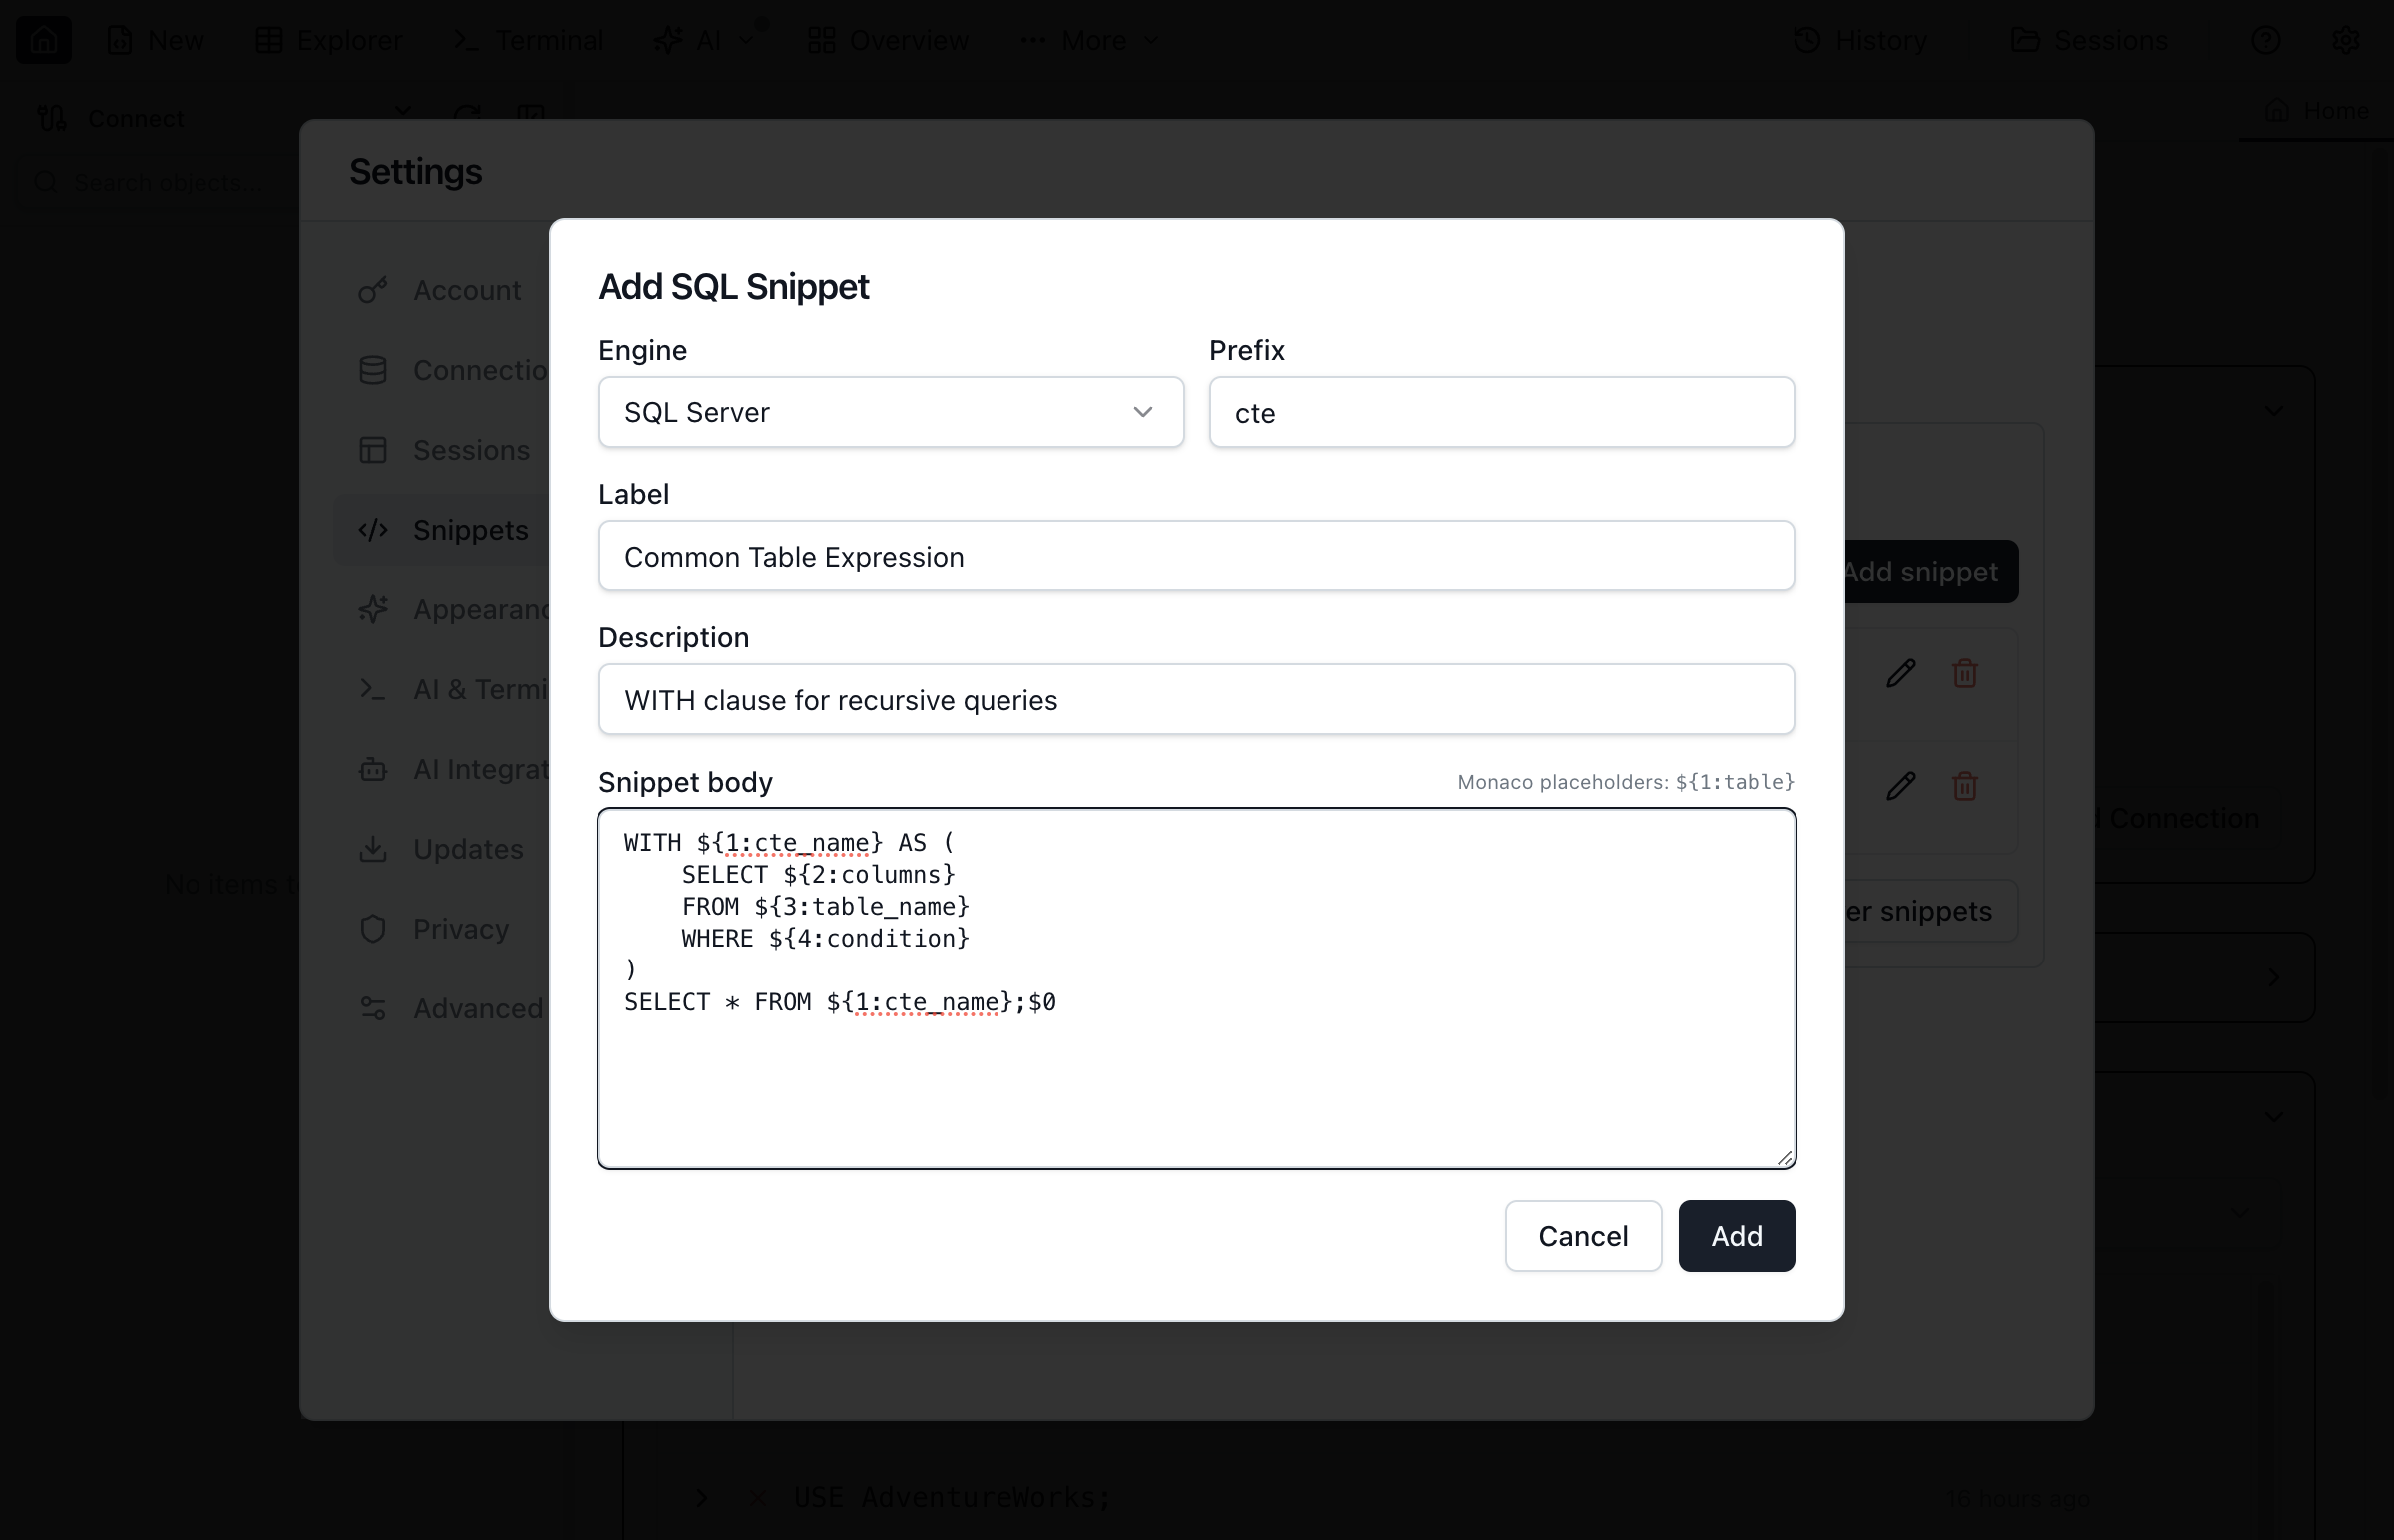
SQL Snippets
Speed up common SQL patterns with built-in snippets. Type a prefix and press Tab to expand:
sel- SELECT statement templateselw- SELECT with WHERE clauseins- INSERT statement templateupd- UPDATE statement templatedel- DELETE statement template
You can also create custom snippets in Settings > Snippets.
Function Signature Help
When you type the opening parenthesis of a function or stored procedure call, Jam SQL Studio shows a parameter-hints popup with the full signature and highlights the currently active argument. As you type commas, the highlight advances to the next parameter.
- Schema-qualified calls —
dbo.ufnGetProductListPrice(resolves with the explicit schema - Unqualified calls —
substring(resolves against the default schema (dbofor MSSQL,publicfor PostgreSQL, current database for MySQL, login schema for Oracle) - Package-qualified calls (Oracle) —
DBMS_OUTPUT.PUT_LINE(resolves package routines - SQLite built-ins — 50+ built-in functions including
substr,json_extract,datetime, and more
Supported across all engines: SQL Server, PostgreSQL, MySQL/MariaDB, Oracle, and SQLite. You can also trigger the popup manually with Cmd+Shift+Space (macOS) or Ctrl+Shift+Space (Windows/Linux) when the cursor is inside a function call.

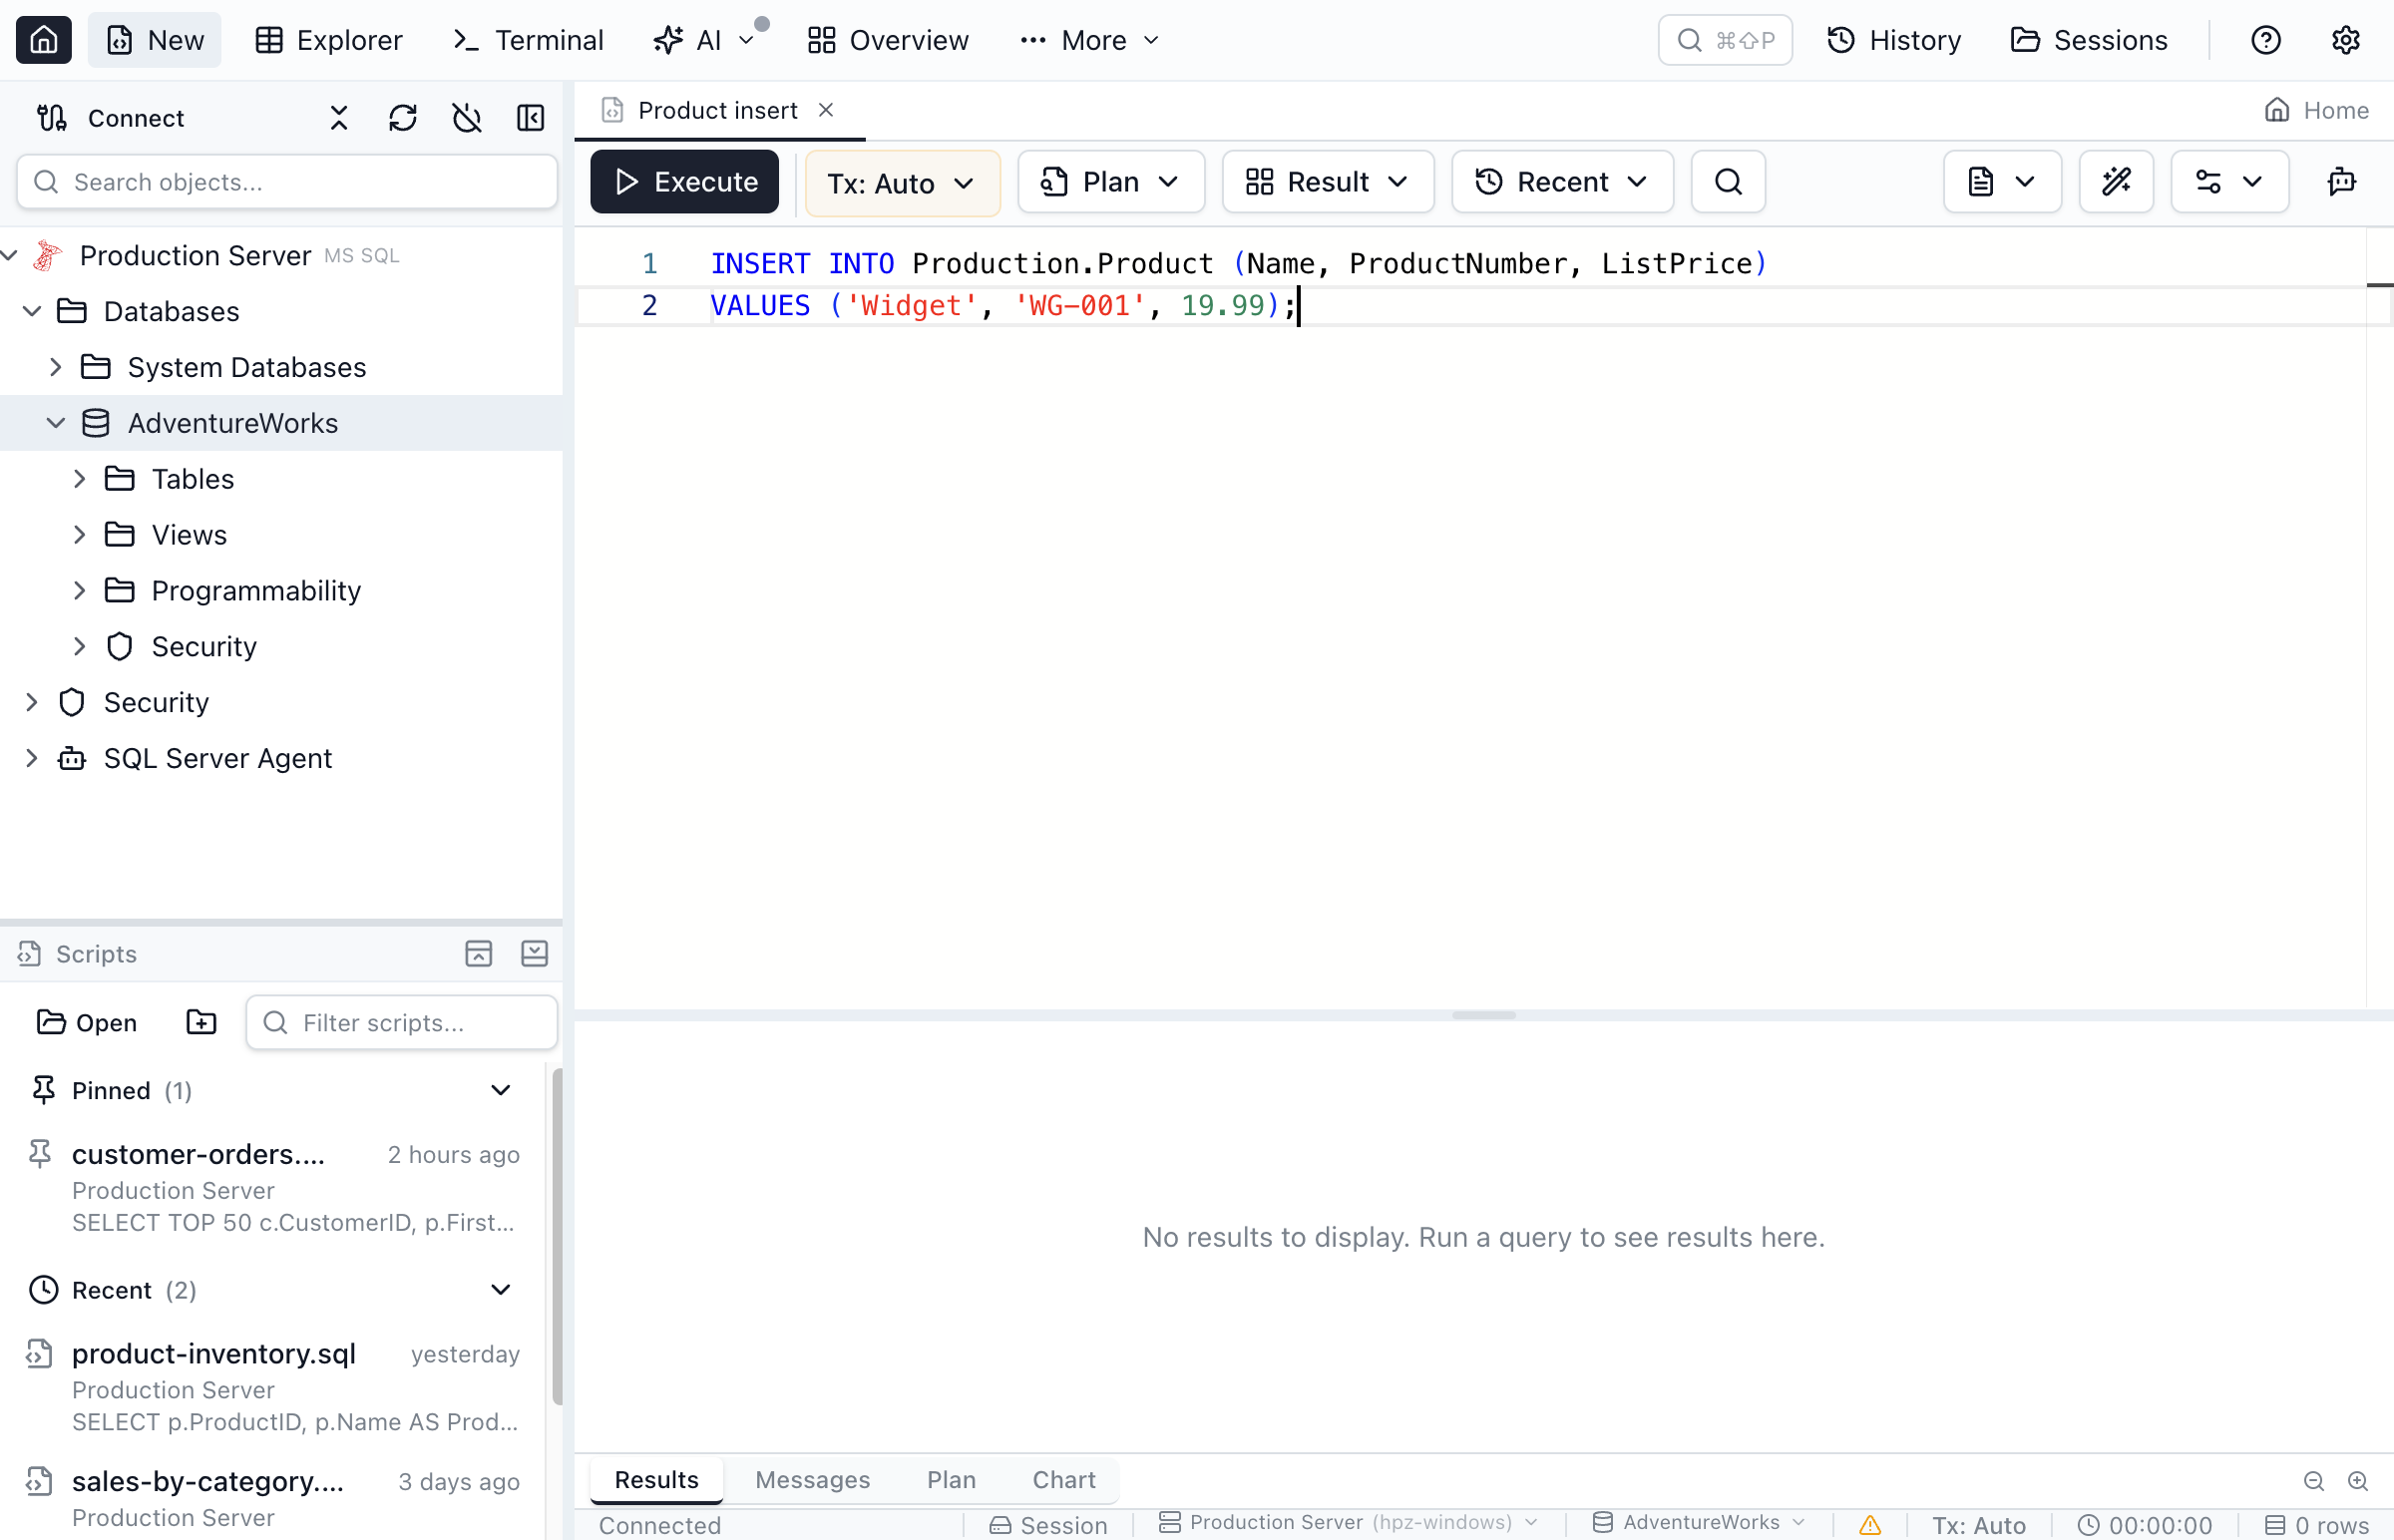
Column Inlay Hints
When writing INSERT INTO ... VALUES (...) statements, Jam SQL Studio shows ghost column names before each value as inlay hints, so you don't have to mentally map column positions.
- With column list —
INSERT INTO table (a, b, c) VALUES (1, 2, 3)shows hints matching the listed columns - Without column list —
INSERT INTO table VALUES (1, 2, 3)resolves column order from the schema cache - Multiple tuples — hints appear for each row in multi-row INSERT statements
Hover over * in SELECT * to see the expanded column list with data types, resolved from the schema cache. For JOINs, columns are prefixed with the table alias.
Executing Queries
Run your queries and view results with multiple execution options.
Basic Execution
- Write your SQL query in the editor
- Press
F5or click the Execute button in the toolbar - View results in the grid below the editor
Execute Selection
To run only part of your query:
- Select the SQL text you want to execute
- A floating action bar appears above (or below) the selection — click Execute to run only the selected SQL
- For safe read-only statements (e.g.
SELECT,WITH), the bar also offers a Peek button that previews the selection inline without disturbing your main results
When the floating Execute appears:
- Your selection must parse as a complete, runnable statement — it starts with a known SQL keyword (
SELECT,WITH,INSERT,UPDATE,DELETE,CREATE,EXEC,PRAGMA, etc.). Fragments likeFROM users, typos likeelect *, or selections ending with a trailing comma do not qualify. - Your selection must not cover the full editor content — if it does, the toolbar Execute already does the same thing and the floating Execute is hidden to avoid redundancy (Peek, however, stays available since inline preview is a distinct action).
- When neither Execute nor Peek qualifies, the whole bar stays hidden.
Note: The toolbar Execute button and F5 always run the entire editor content — use the floating Execute button next to your selection to run just a portion. The floating Execute intentionally skips Format on execute so your selection isn't lost during formatting.
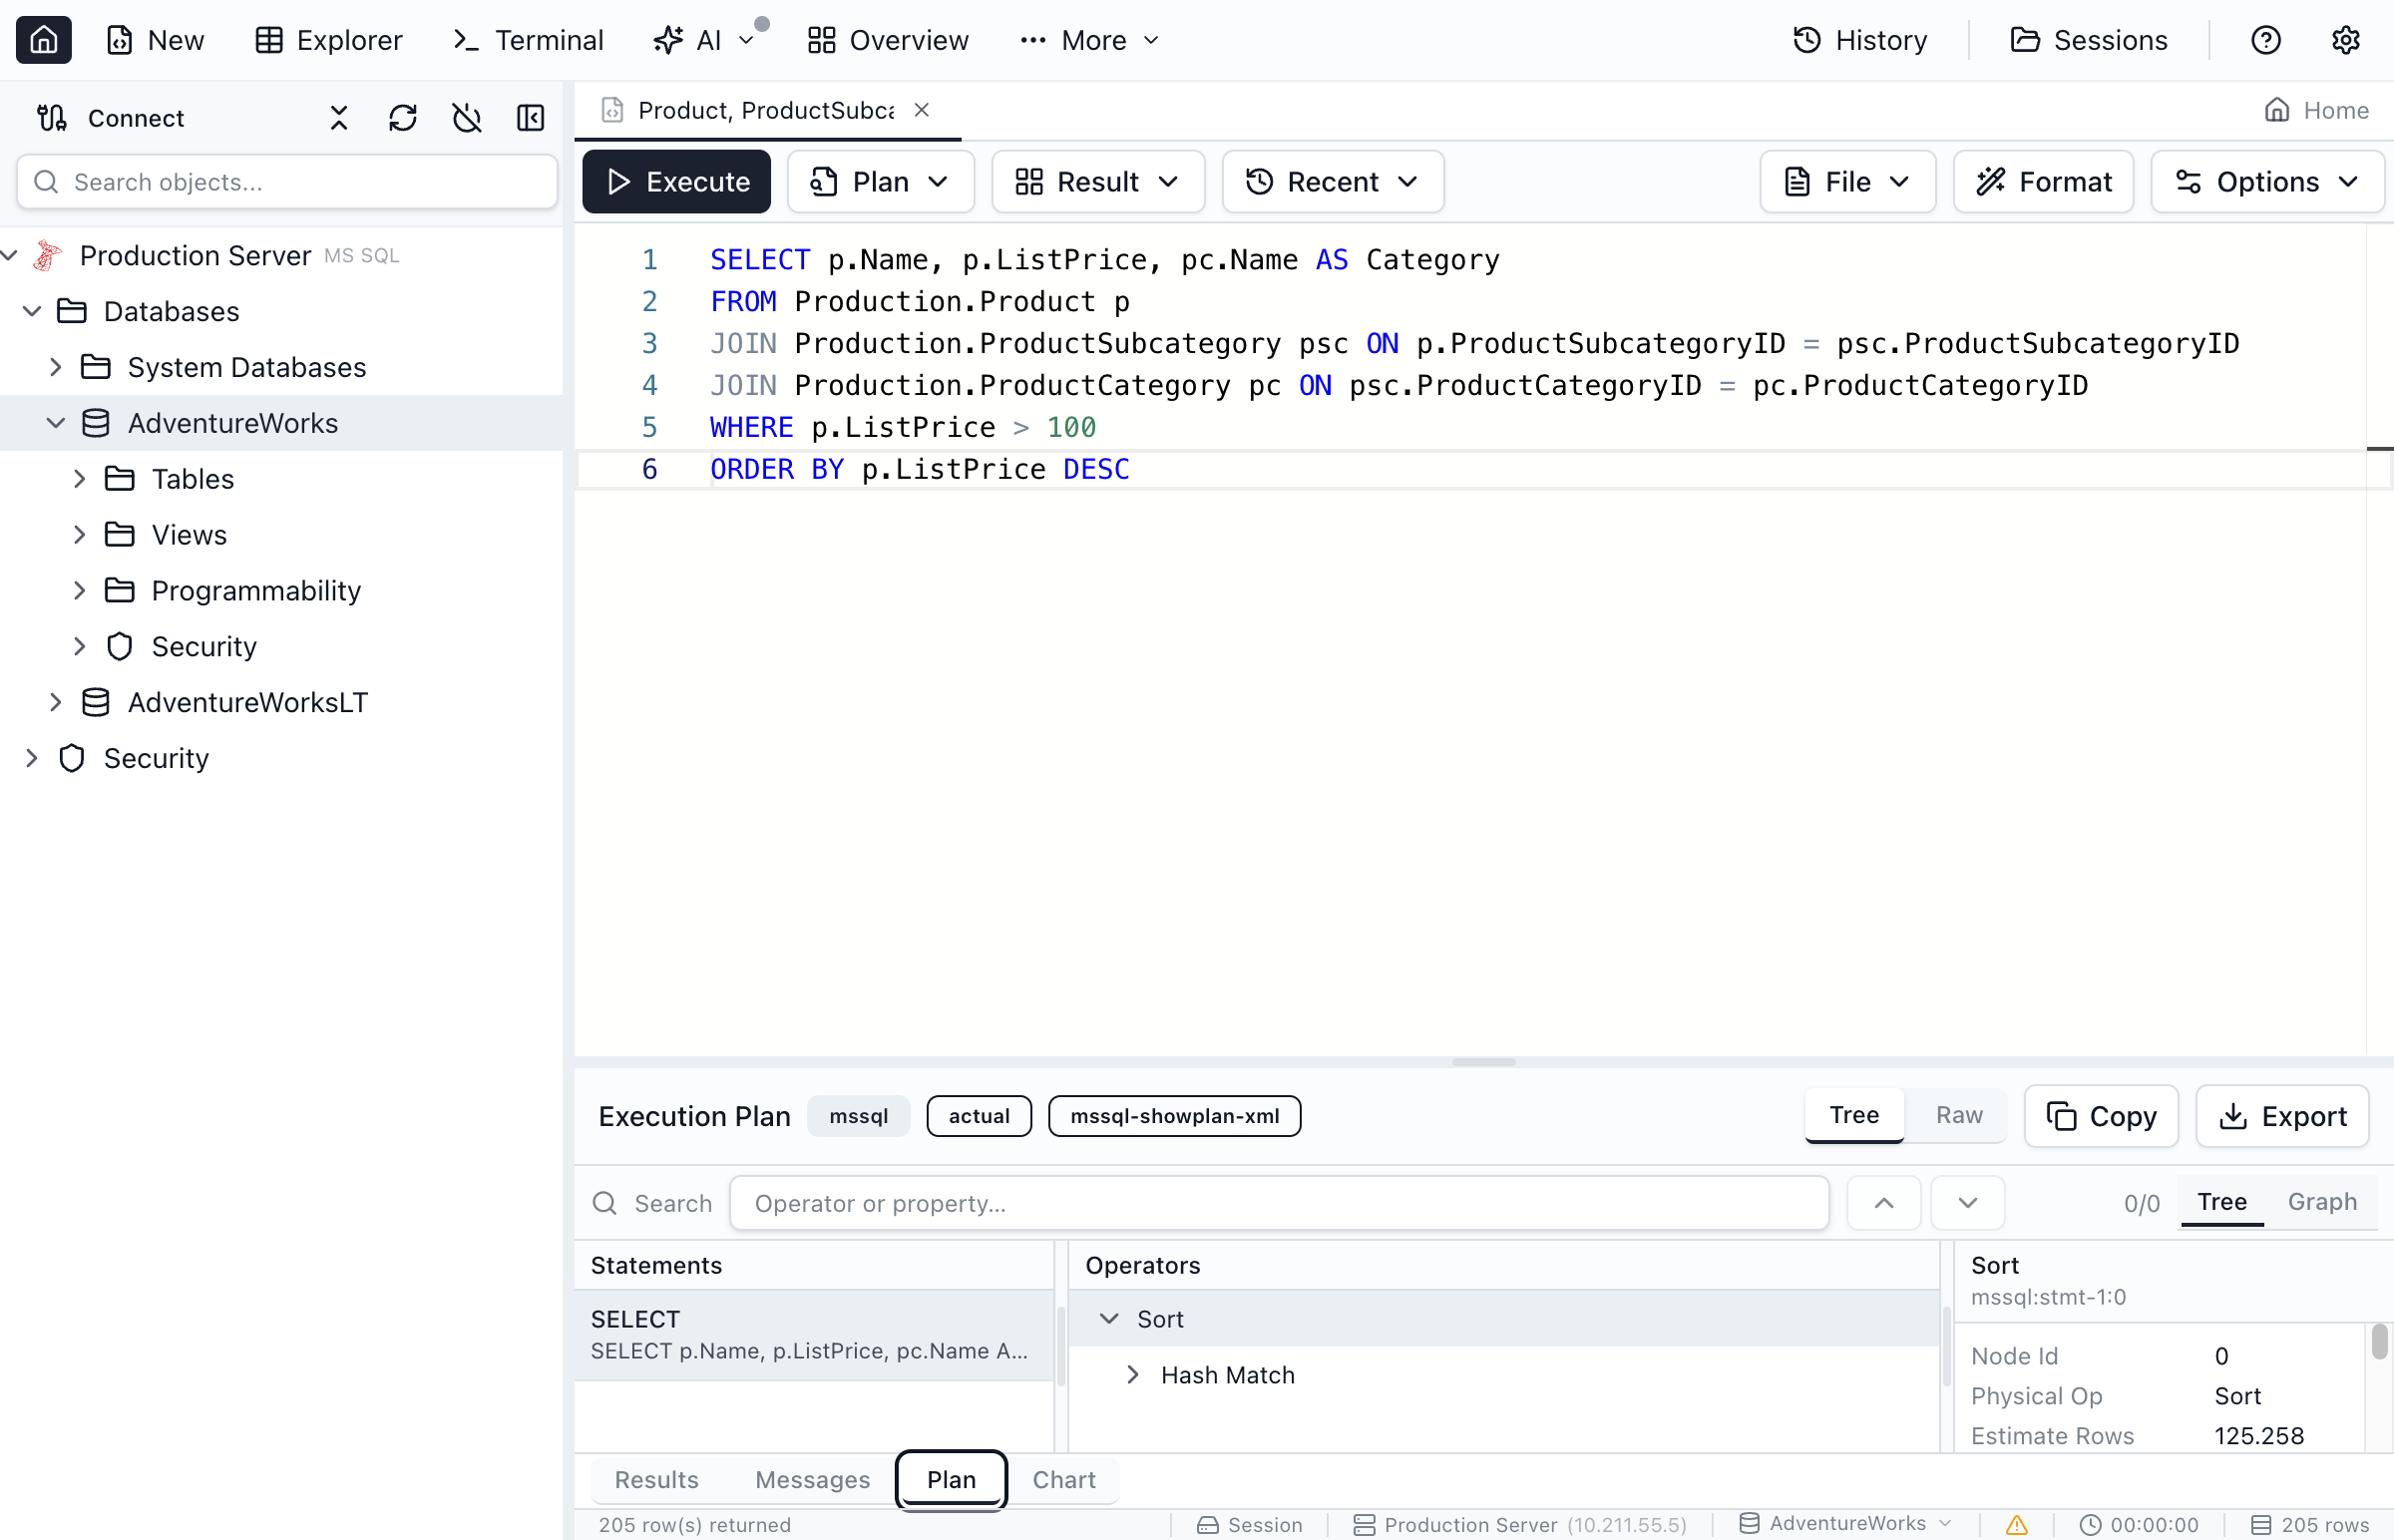
Execution Plan Options
Analyze query performance by capturing execution plans:
- Execute with Estimated Plan - Shows the query plan without running the query
- Execute with Actual Plan - Runs the query and shows the actual execution statistics
Cancelling Queries
To cancel a long-running query:
- Click the Stop button in the toolbar, or
- Press
Escapewhile the query is running
Long-Running Query Affordances
When a query has been running for more than 8 seconds, two subtle cues appear — neither shifts the toolbar:
- The execution-time timer in the bottom status bar turns amber and pulses gently once per second so you can see at a glance that the query has crossed the threshold.
- The “Executing query…” indicator above the results grid changes to “Executing query… taking longer” (amber) and exposes a one-click Stop button.
The toolbar Stop button is always available during execution if you'd rather cancel from there.
Query Timeout
The default query execution timeout is 5 minutes. You can change it in Settings > Query Execution — set a longer value for heavy maintenance scripts, or a shorter one if you want runaway queries to fail fast. A value of 0 disables the timeout entirely.
For SQL Server, multi-batch scripts (separated by GO) execute each batch independently and the configured timeout applies to each batch, not to the whole script — a long maintenance script split into many short batches will not be killed even if its total wall-clock time exceeds the timeout.
The same setting governs transaction-mode (BEGIN TRANSACTION) tabs, Table Explorer browsing and editing, and estimated-plan capture. A query that exceeds the timeout fails with a clear timeout message (and a tip pointing back to the setting); a connection that drops mid-query is reported as a connection failure with a reconnect banner instead.
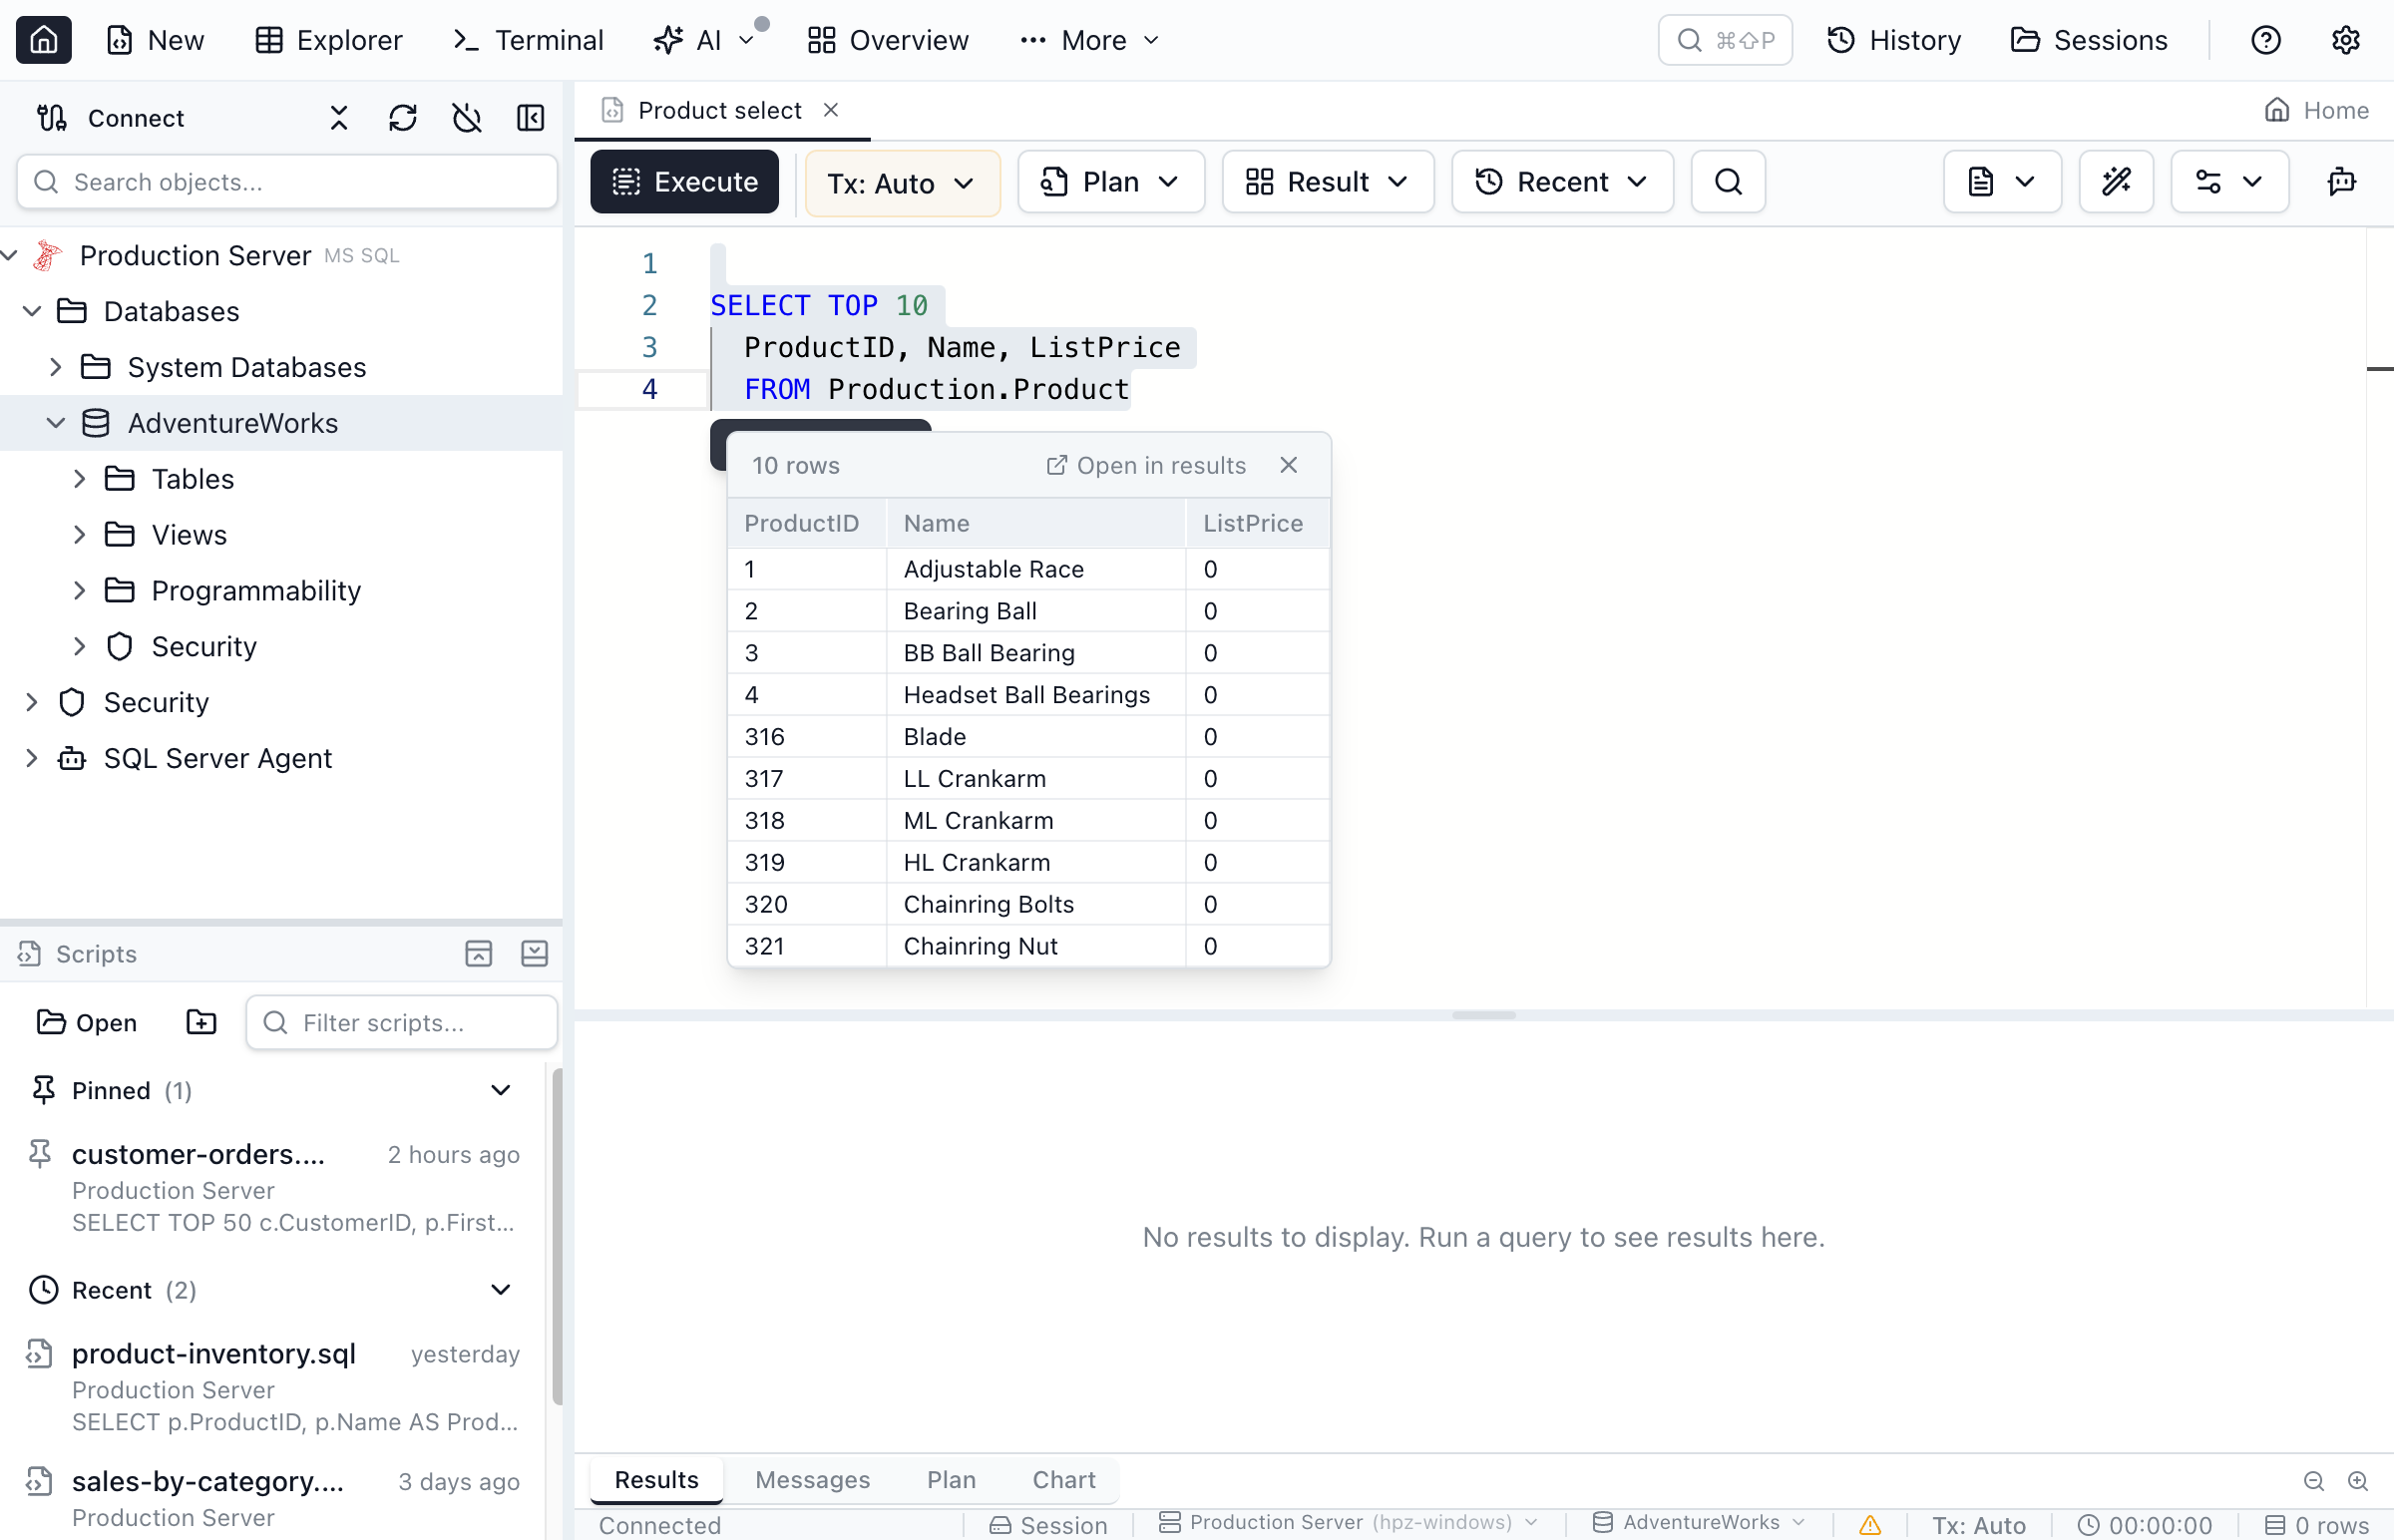
Peek Results
Select a SQL query in the editor and a floating Peek results button appears above the selection. Click it to preview results inline without replacing your main result set.
- Results appear in a compact inline panel below the selection (max 50 rows)
- An automatic row limit is added to keep previews fast (TOP 50 for SQL Server, LIMIT 50 for others)
- Peek results do not affect your main results or query history
- Click Open in results to run the full query in the main editor
Working with Results
Query results appear in a tabbed grid below the editor with powerful viewing and export options.
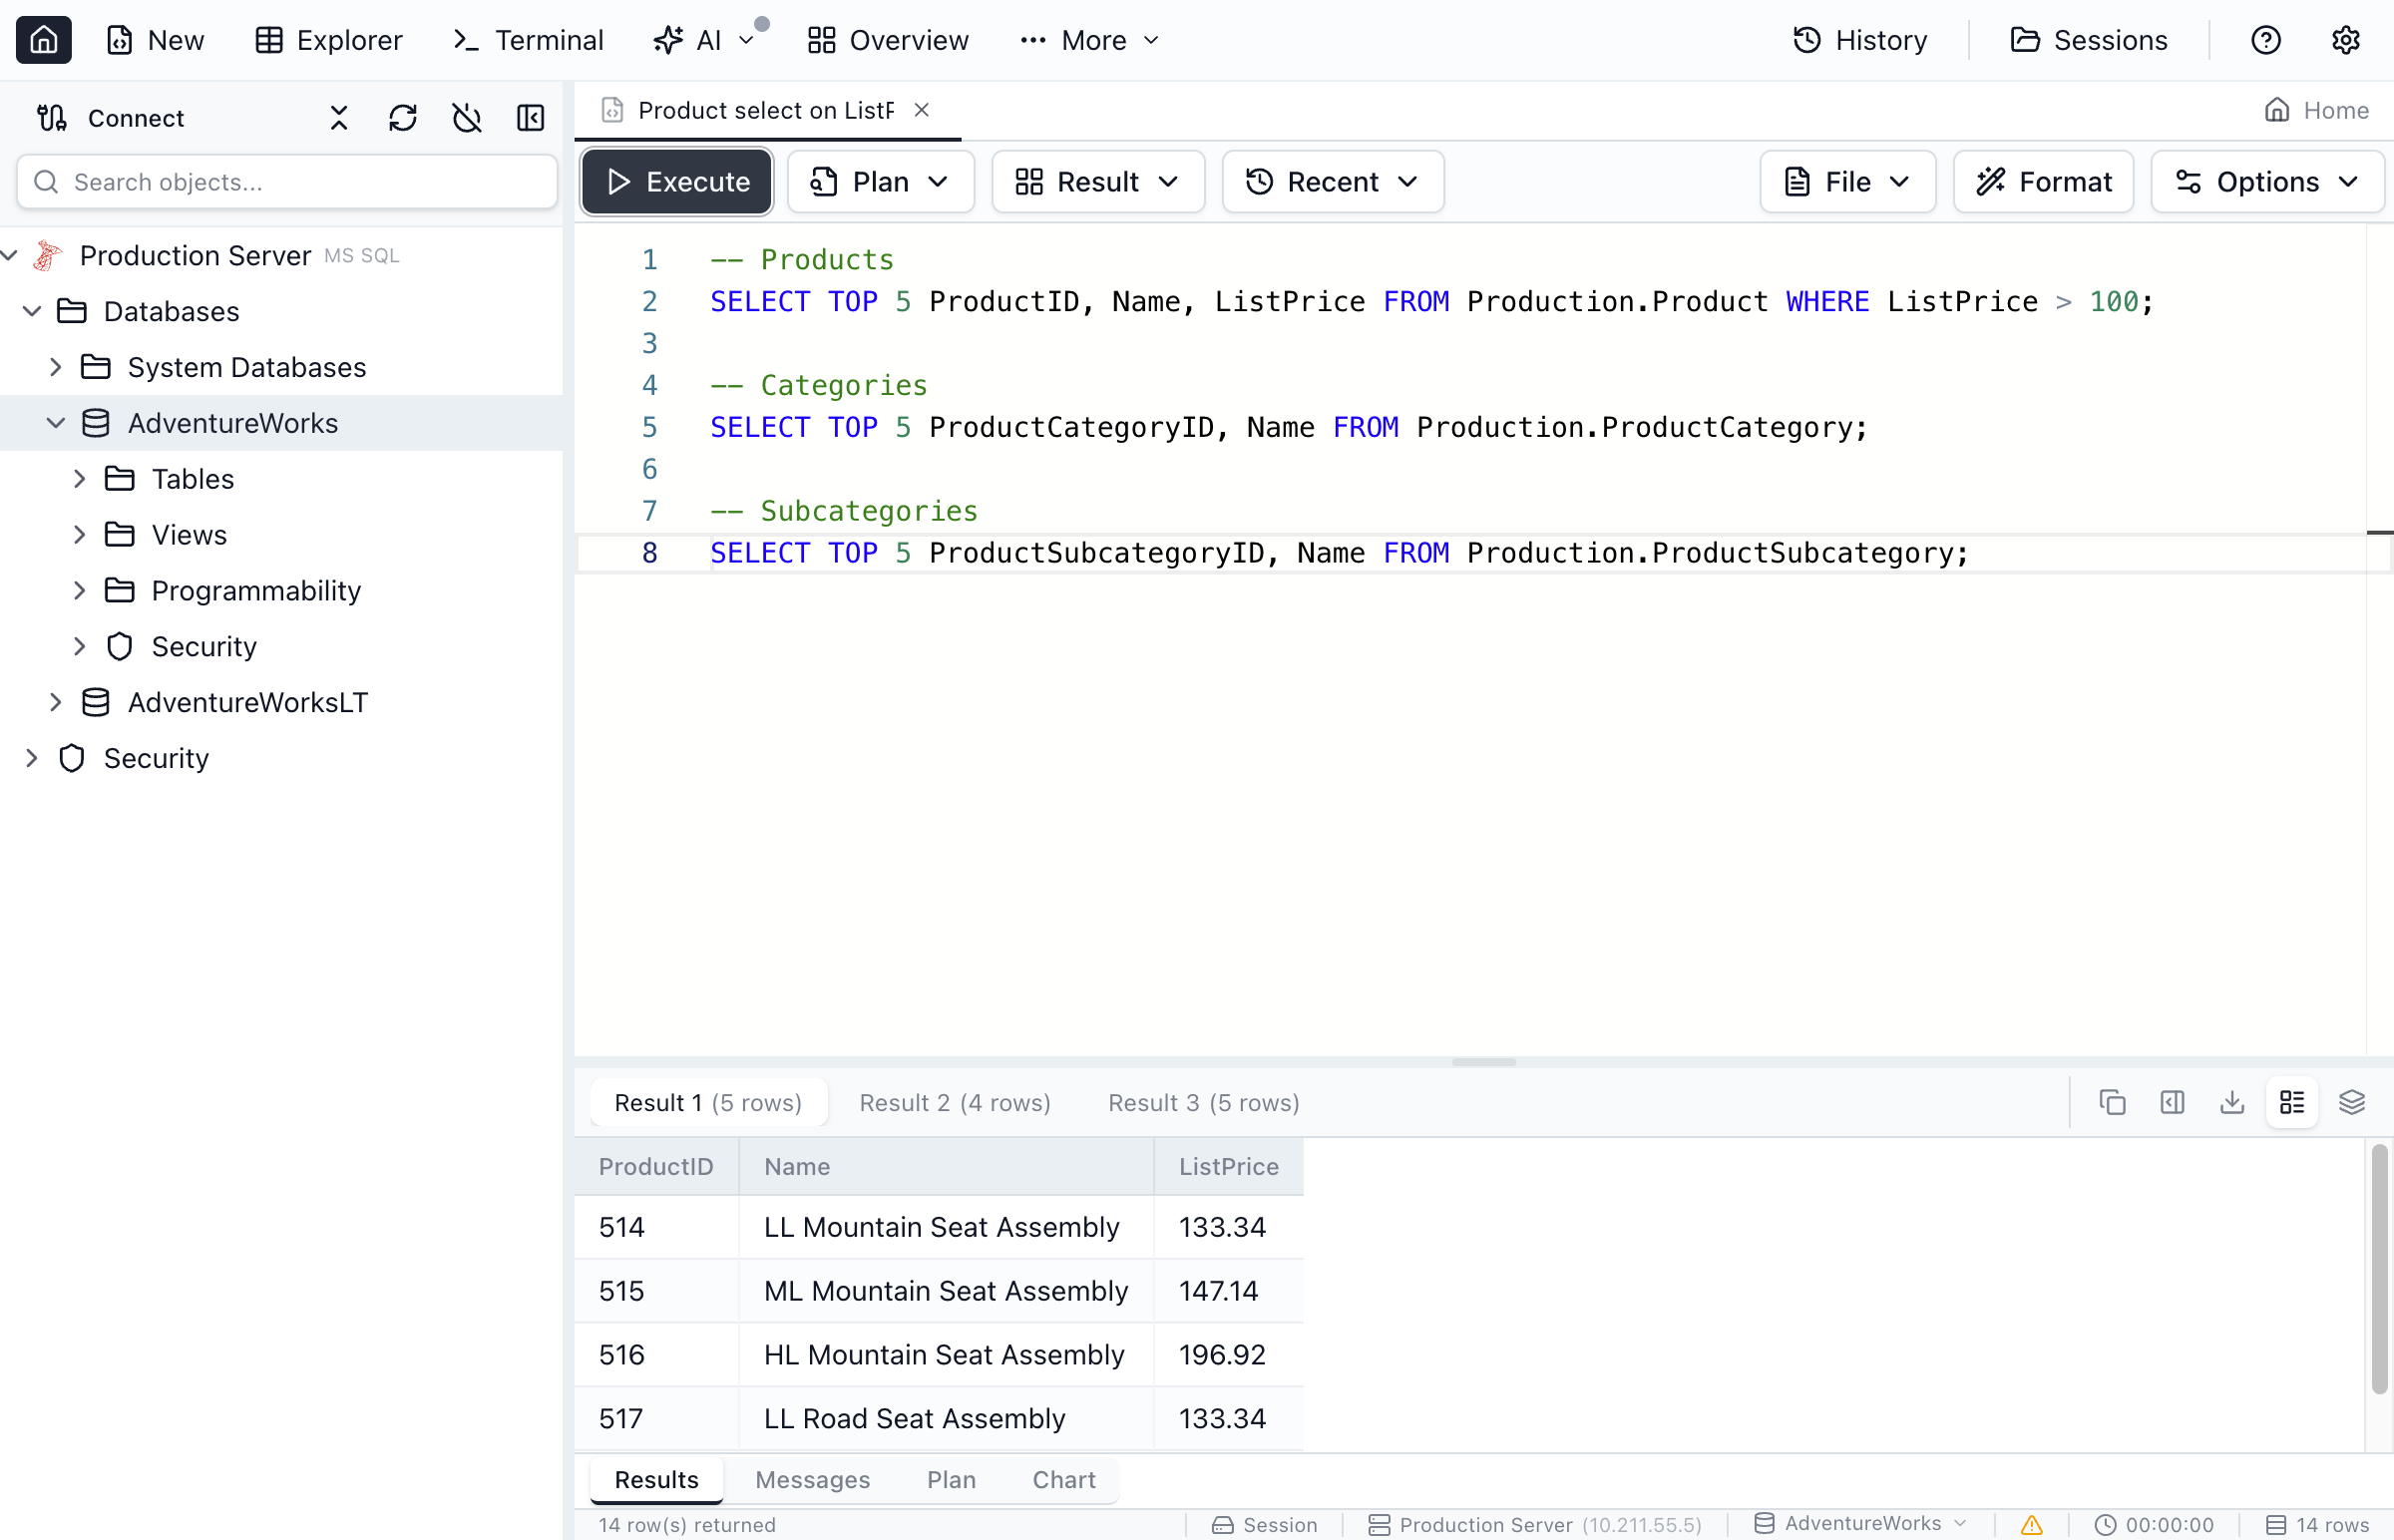
Multiple Result Sets
When your query returns multiple result sets (e.g., multiple SELECT statements), each appears in its own tab. You can also switch to a stacked view to see all results vertically.
Collapsing the Results Pane
When you're writing or reviewing long SQL, you can hide the results pane to give the editor the full height. Click the chevron button on the right side of the results tab bar (next to the zoom controls), press Cmd+J / Ctrl+J, or run Toggle Results Pane from the Command Palette (Cmd+Shift+P / Ctrl+Shift+P).
To restore, use any of the same actions, or just click one of the tab labels (Results / Messages / Plan / Chart) — Jam SQL Studio reopens the pane and switches to the clicked tab. Dragging the resizer also restores the pane. Each query tab remembers its own collapsed state while it is open.
Messages and Output
The bottom pane always shows a Messages tab with status messages, errors, warnings, and row-count notes. When your script also emits user PRINT statements alongside multiple result sets, an extra Output tab appears in the result-set tab strip, to the left of Result 1. Activating it shows an interleaved view of the script: each PRINT line appears at its script position, with clickable [Result N] references where each result set landed — clicking a reference jumps to that result-set tab. In Stacked view, the Output content collapses to a 3-line preview at the top of the stack; expand it to see the full interleaved output.
Grid Features
- Column sorting - Click column headers to sort
- Column resizing - Drag column borders to resize
- Duplicate column names - When multiple columns share the same name (e.g.,
SELECT *with JOINs), Jam shows each column separately and displays the source table above the column name (including when running inside a Manual transaction on SQL Server) - Copy as CSV - Copy the active result set to your clipboard from the results toolbar
- Row side panel - Select a row and open the side panel (or double-click a row) to view values in a vertical layout (drag the divider to resize). When results include columns from multiple tables, Jam shows the source table next to each field.
- Edit results (UPDATE) - Toggle edit mode (pencil icon) to update editable cells inline (requires a primary key in the result)
- JSON viewer - Click JSON cells to view formatted JSON in a dialog (with a Copy button). If the value is not valid JSON, the dialog shows an error and the raw value as text.
- Expanded text viewer - Cells with multiple lines (newlines) show an expand icon to open the value in a read-only dialog (with a Copy button and JSON/Text mode tabs)
- NULL indicators - NULL values shown with distinct styling
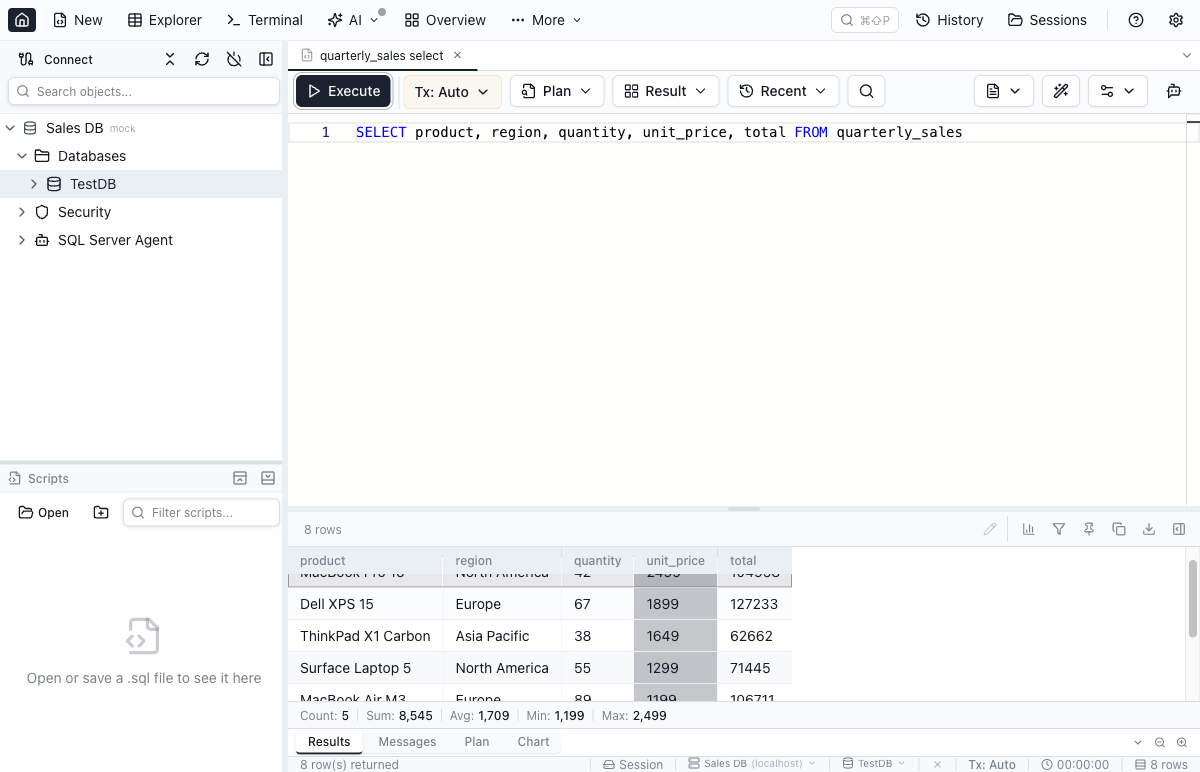
Cell Selection and Aggregates
Select cells in the results grid to see instant aggregate statistics in a status bar at the bottom, similar to Excel's status bar.
- Click a cell to select it
- Shift+Click to select a rectangular range of cells
- Cmd+Click / Ctrl+Click to add individual cells to the selection
- Click+Drag across cells to select a range
The aggregate bar shows Count for all selected cells. When numeric cells are selected, it also shows Sum, Avg, Min, and Max.
Press Cmd+C / Ctrl+C to copy selected cell values to the clipboard as tab-separated text (paste-friendly into Excel and Google Sheets). Right-click and choose Copy value to do the same from the context menu.
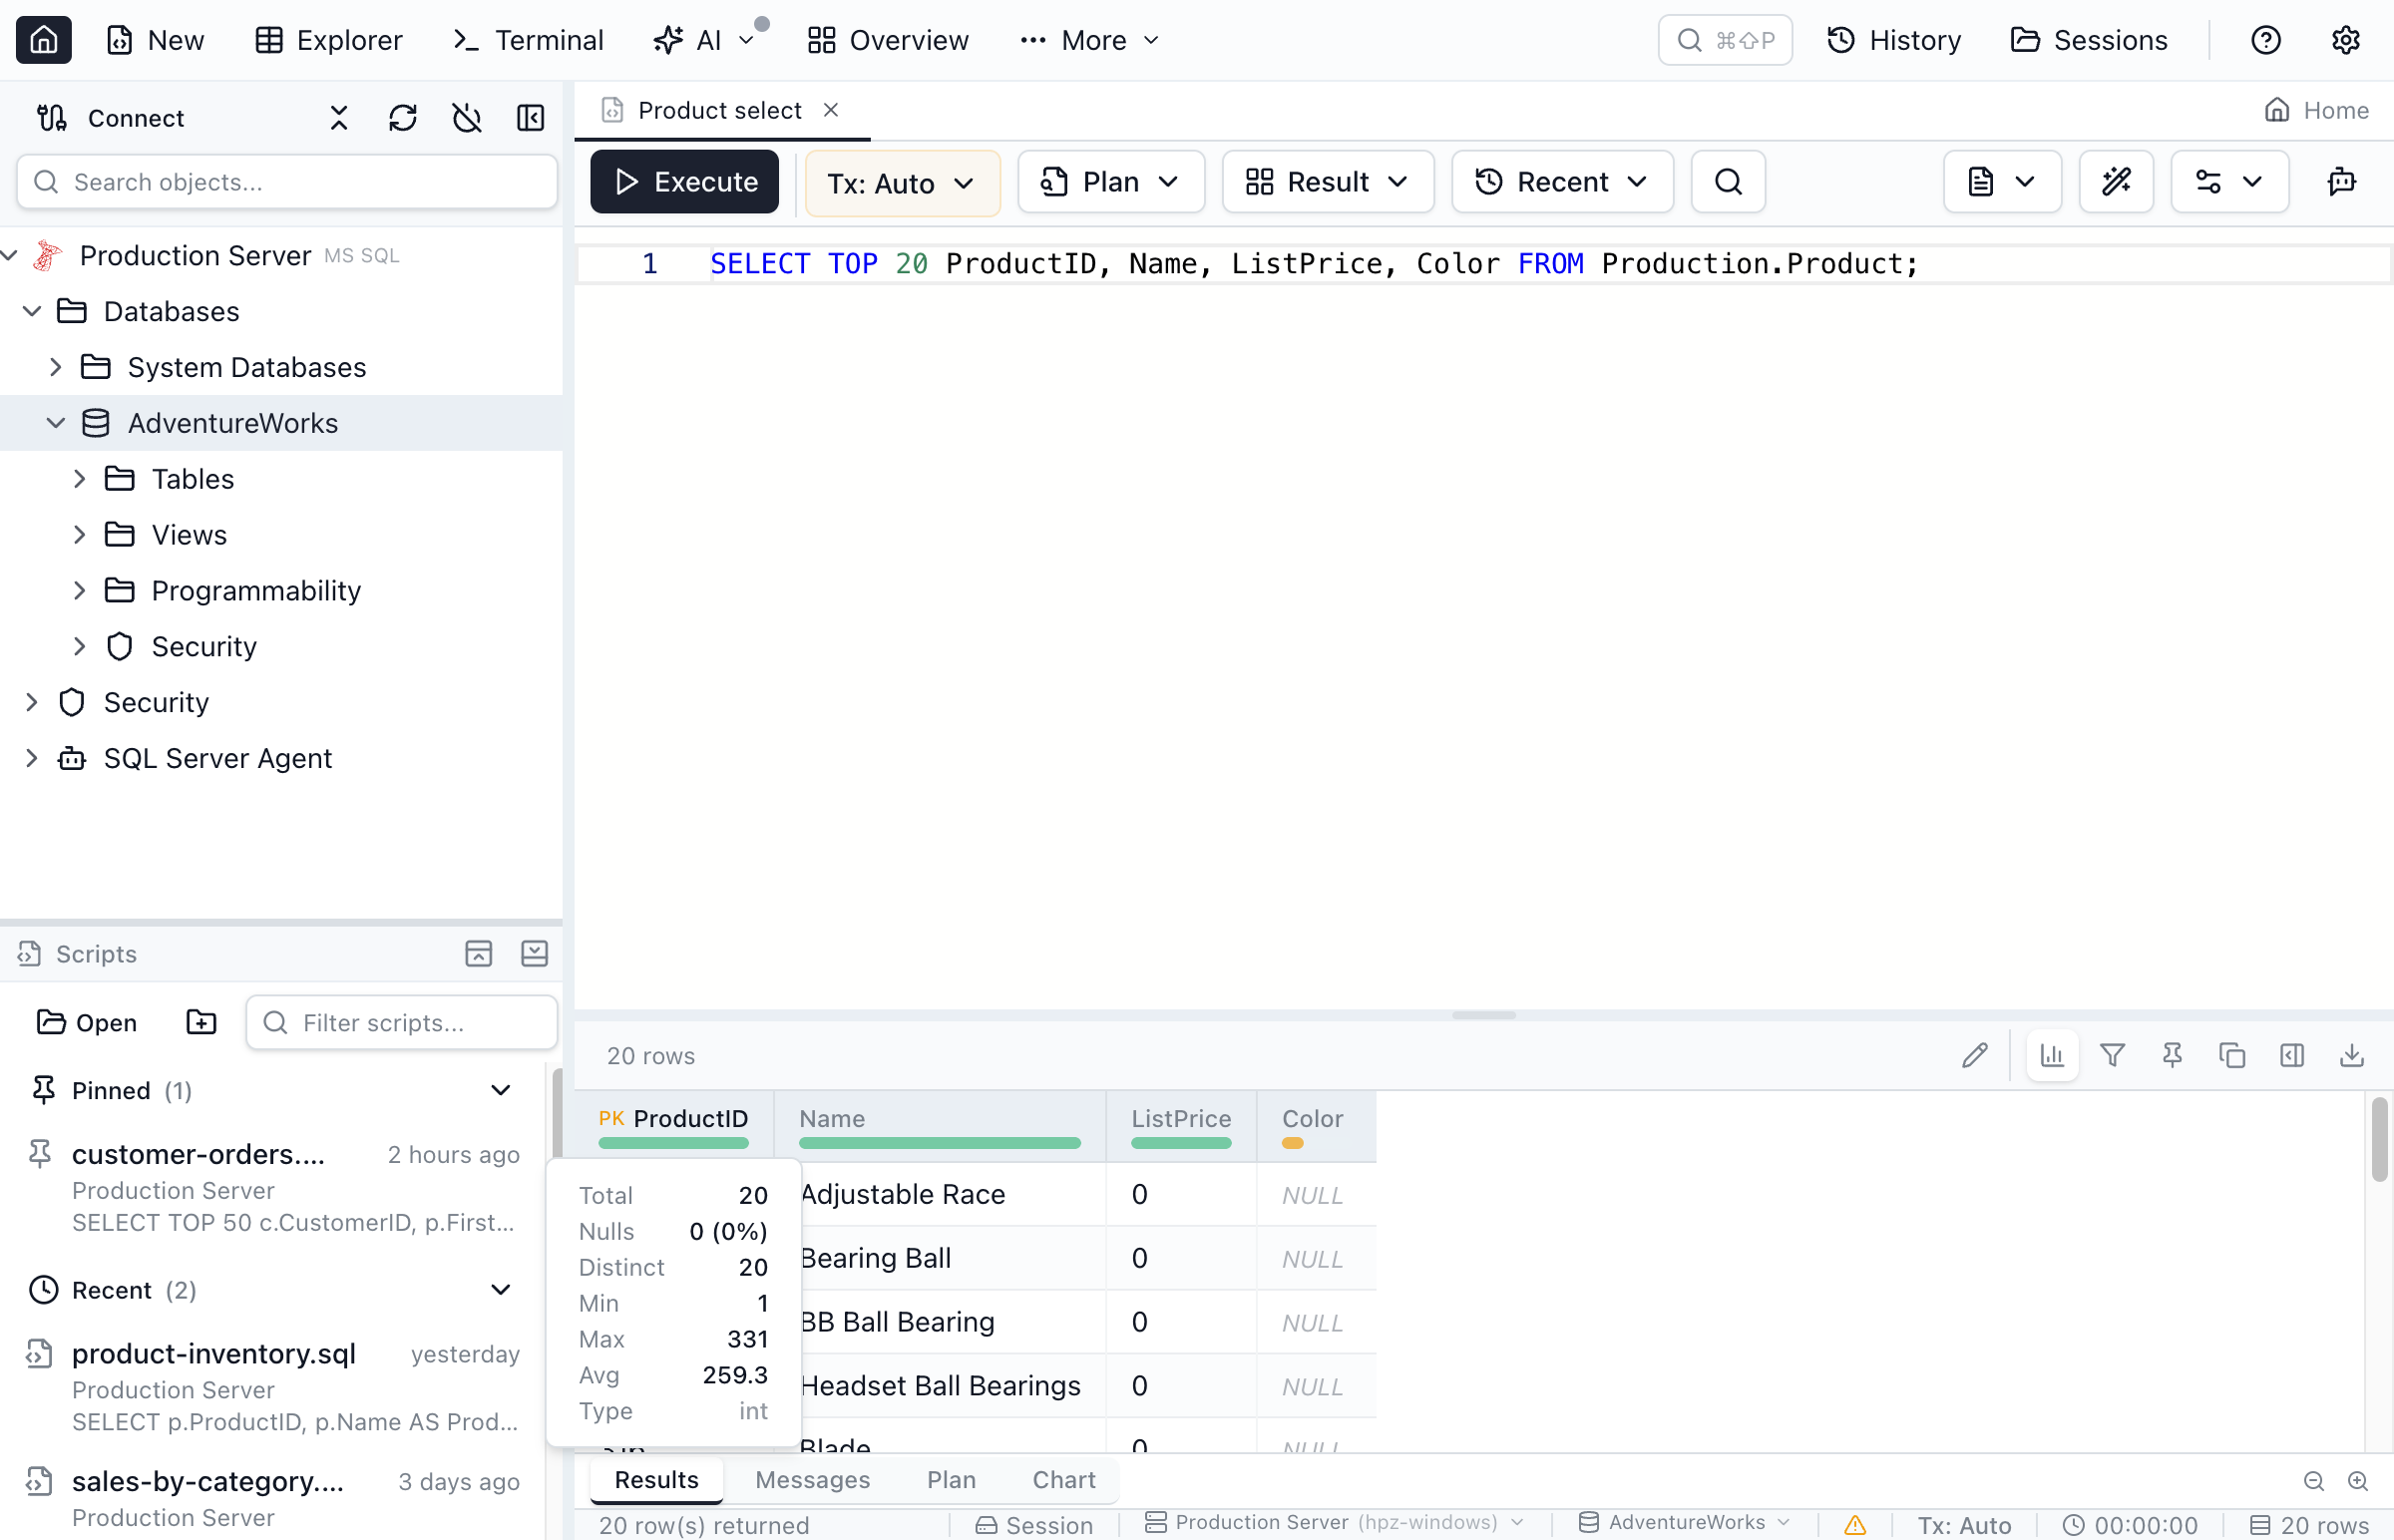
Column Profiling
Toggle column profiling (bar chart icon in the results toolbar) to see per-column statistics displayed below each column header.
- Null indicator bar — green (all values), amber (some nulls), red (all nulls)
- Hover tooltip — shows Total count, Null %, Distinct count, Min, Max, and Avg (for numeric columns)
- Stats are computed client-side from loaded rows — no additional database round-trip
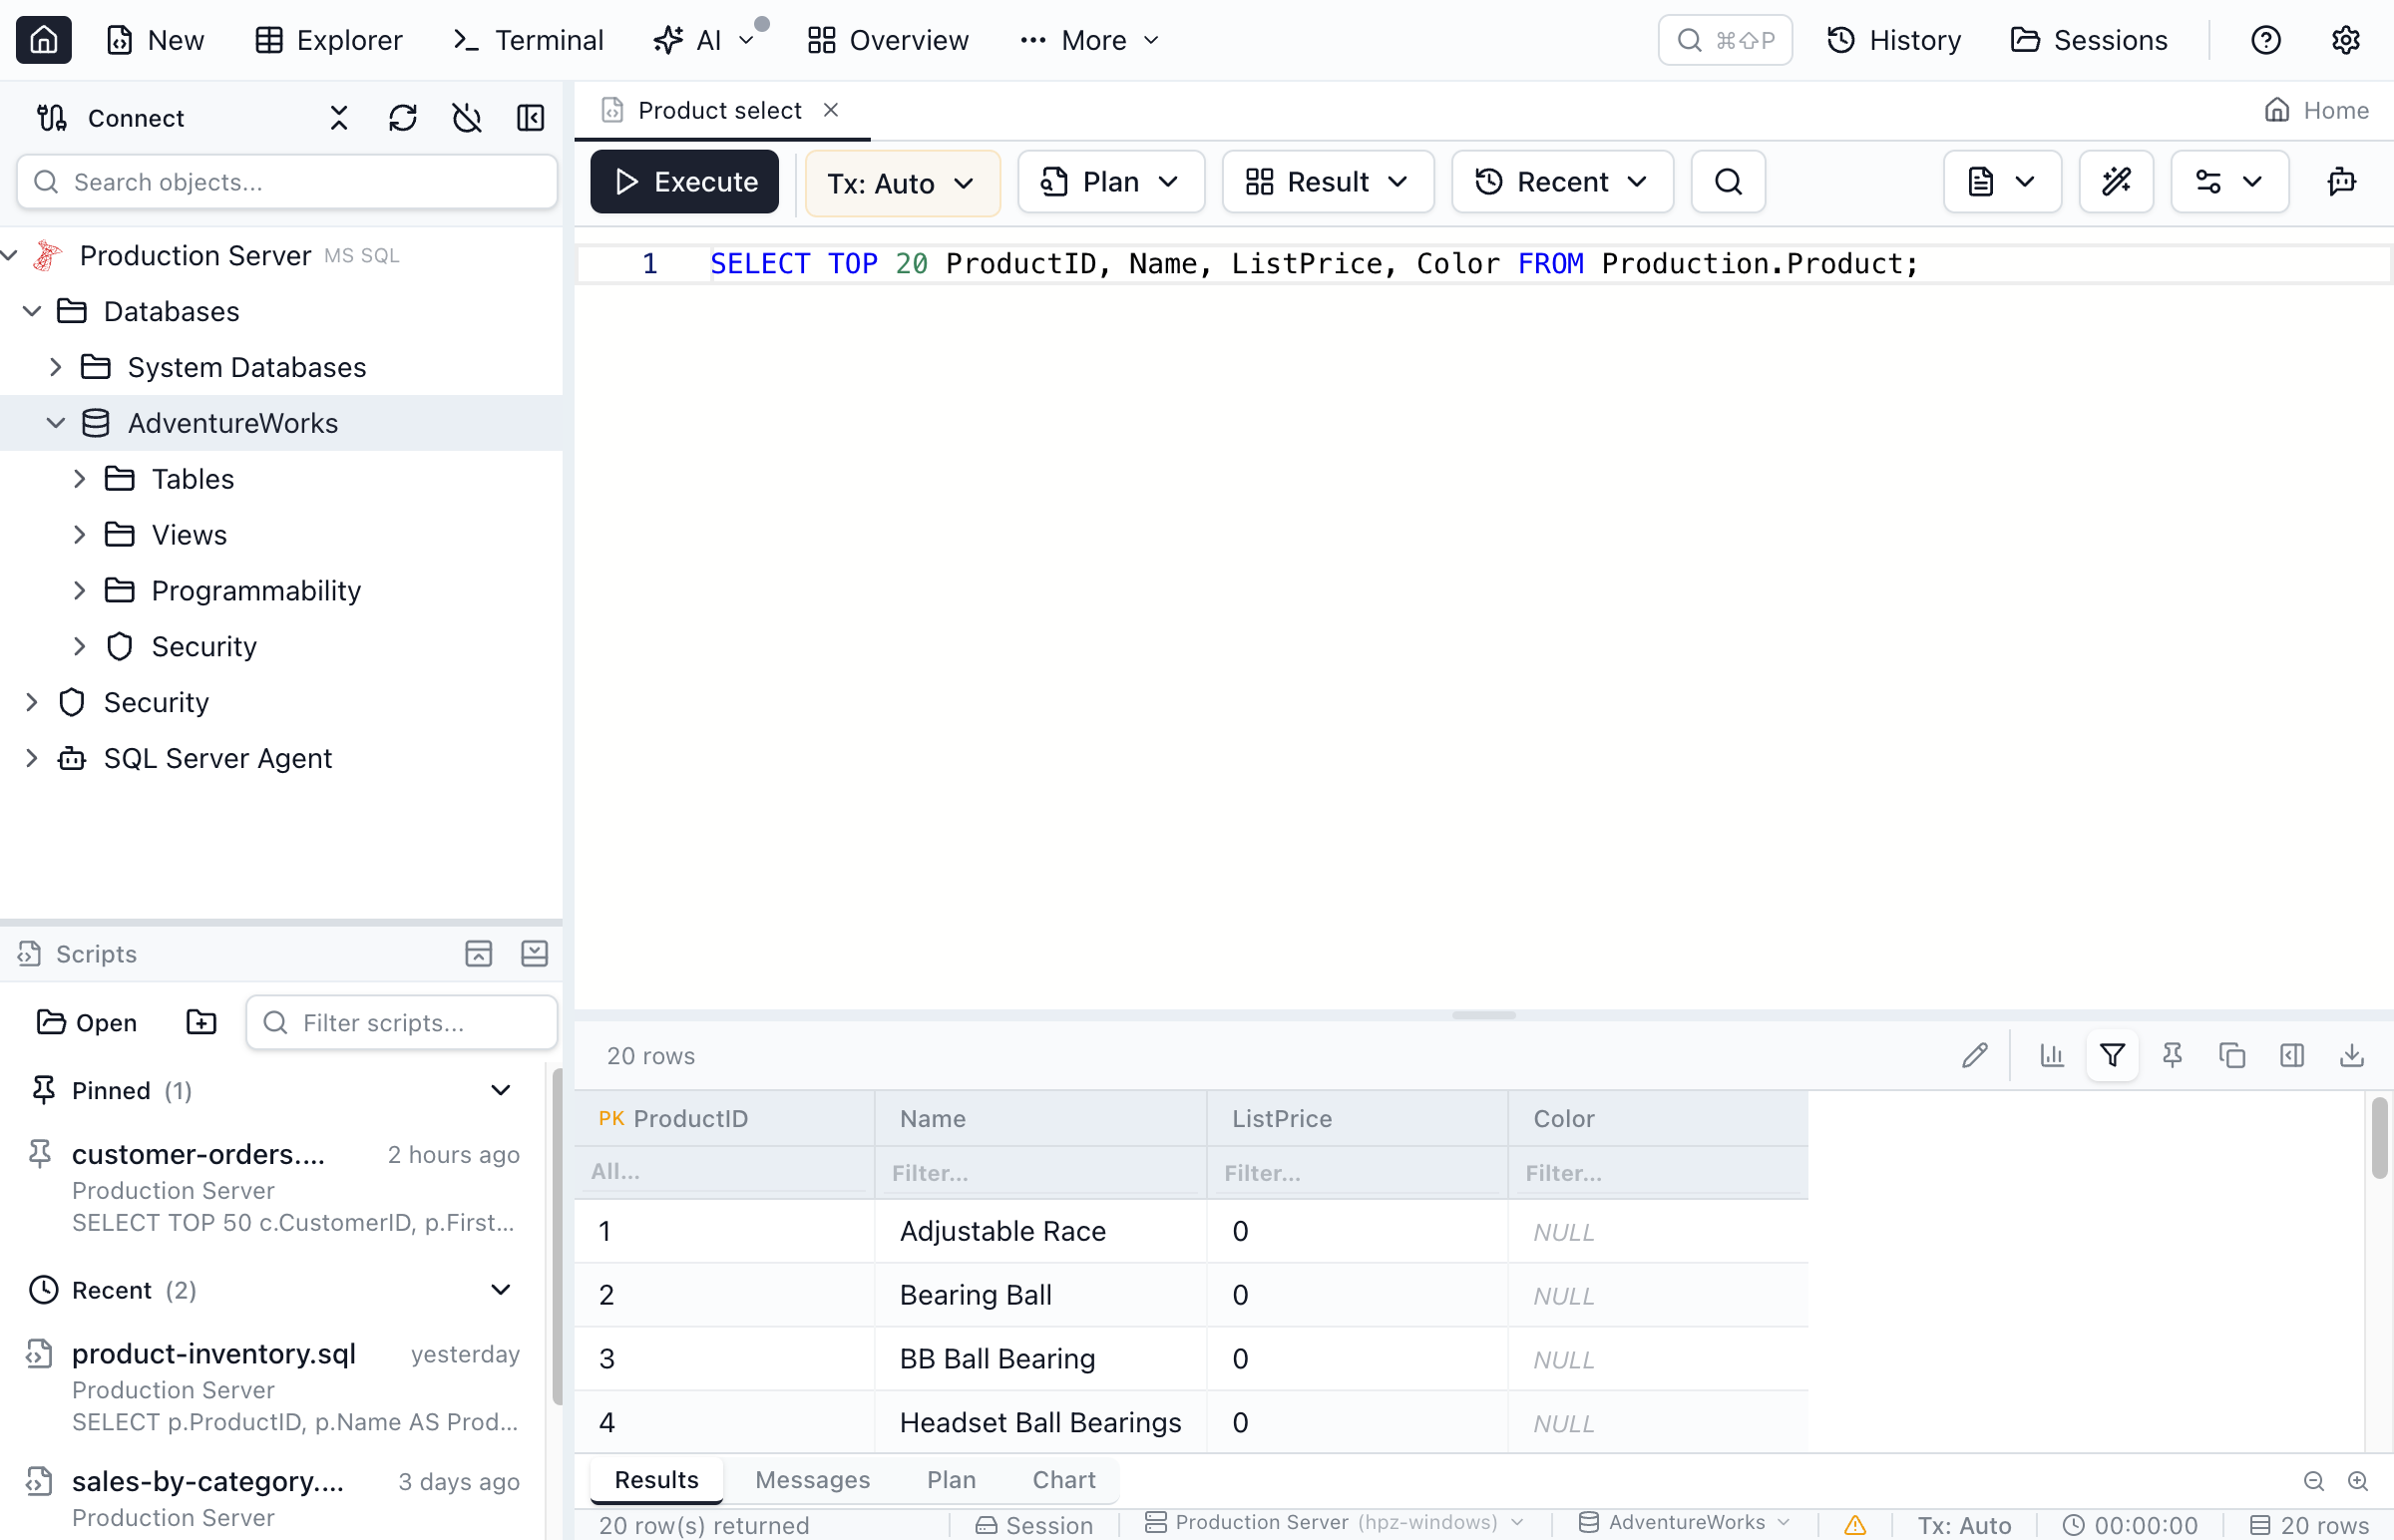
Result Filtering
Toggle the filter row (funnel icon in the results toolbar) to filter already-loaded results without re-executing the query.
- Per-column filters — type in individual column filter inputs for targeted filtering
- Global search — use the leftmost input to search across all columns simultaneously
- Filtering is instant with a 150ms debounce — results update as you type
- The toolbar shows "X of Y rows" when a filter is active
- Cell aggregates and sorting operate on filtered rows only
- Press Escape or clear all inputs to restore the full result set
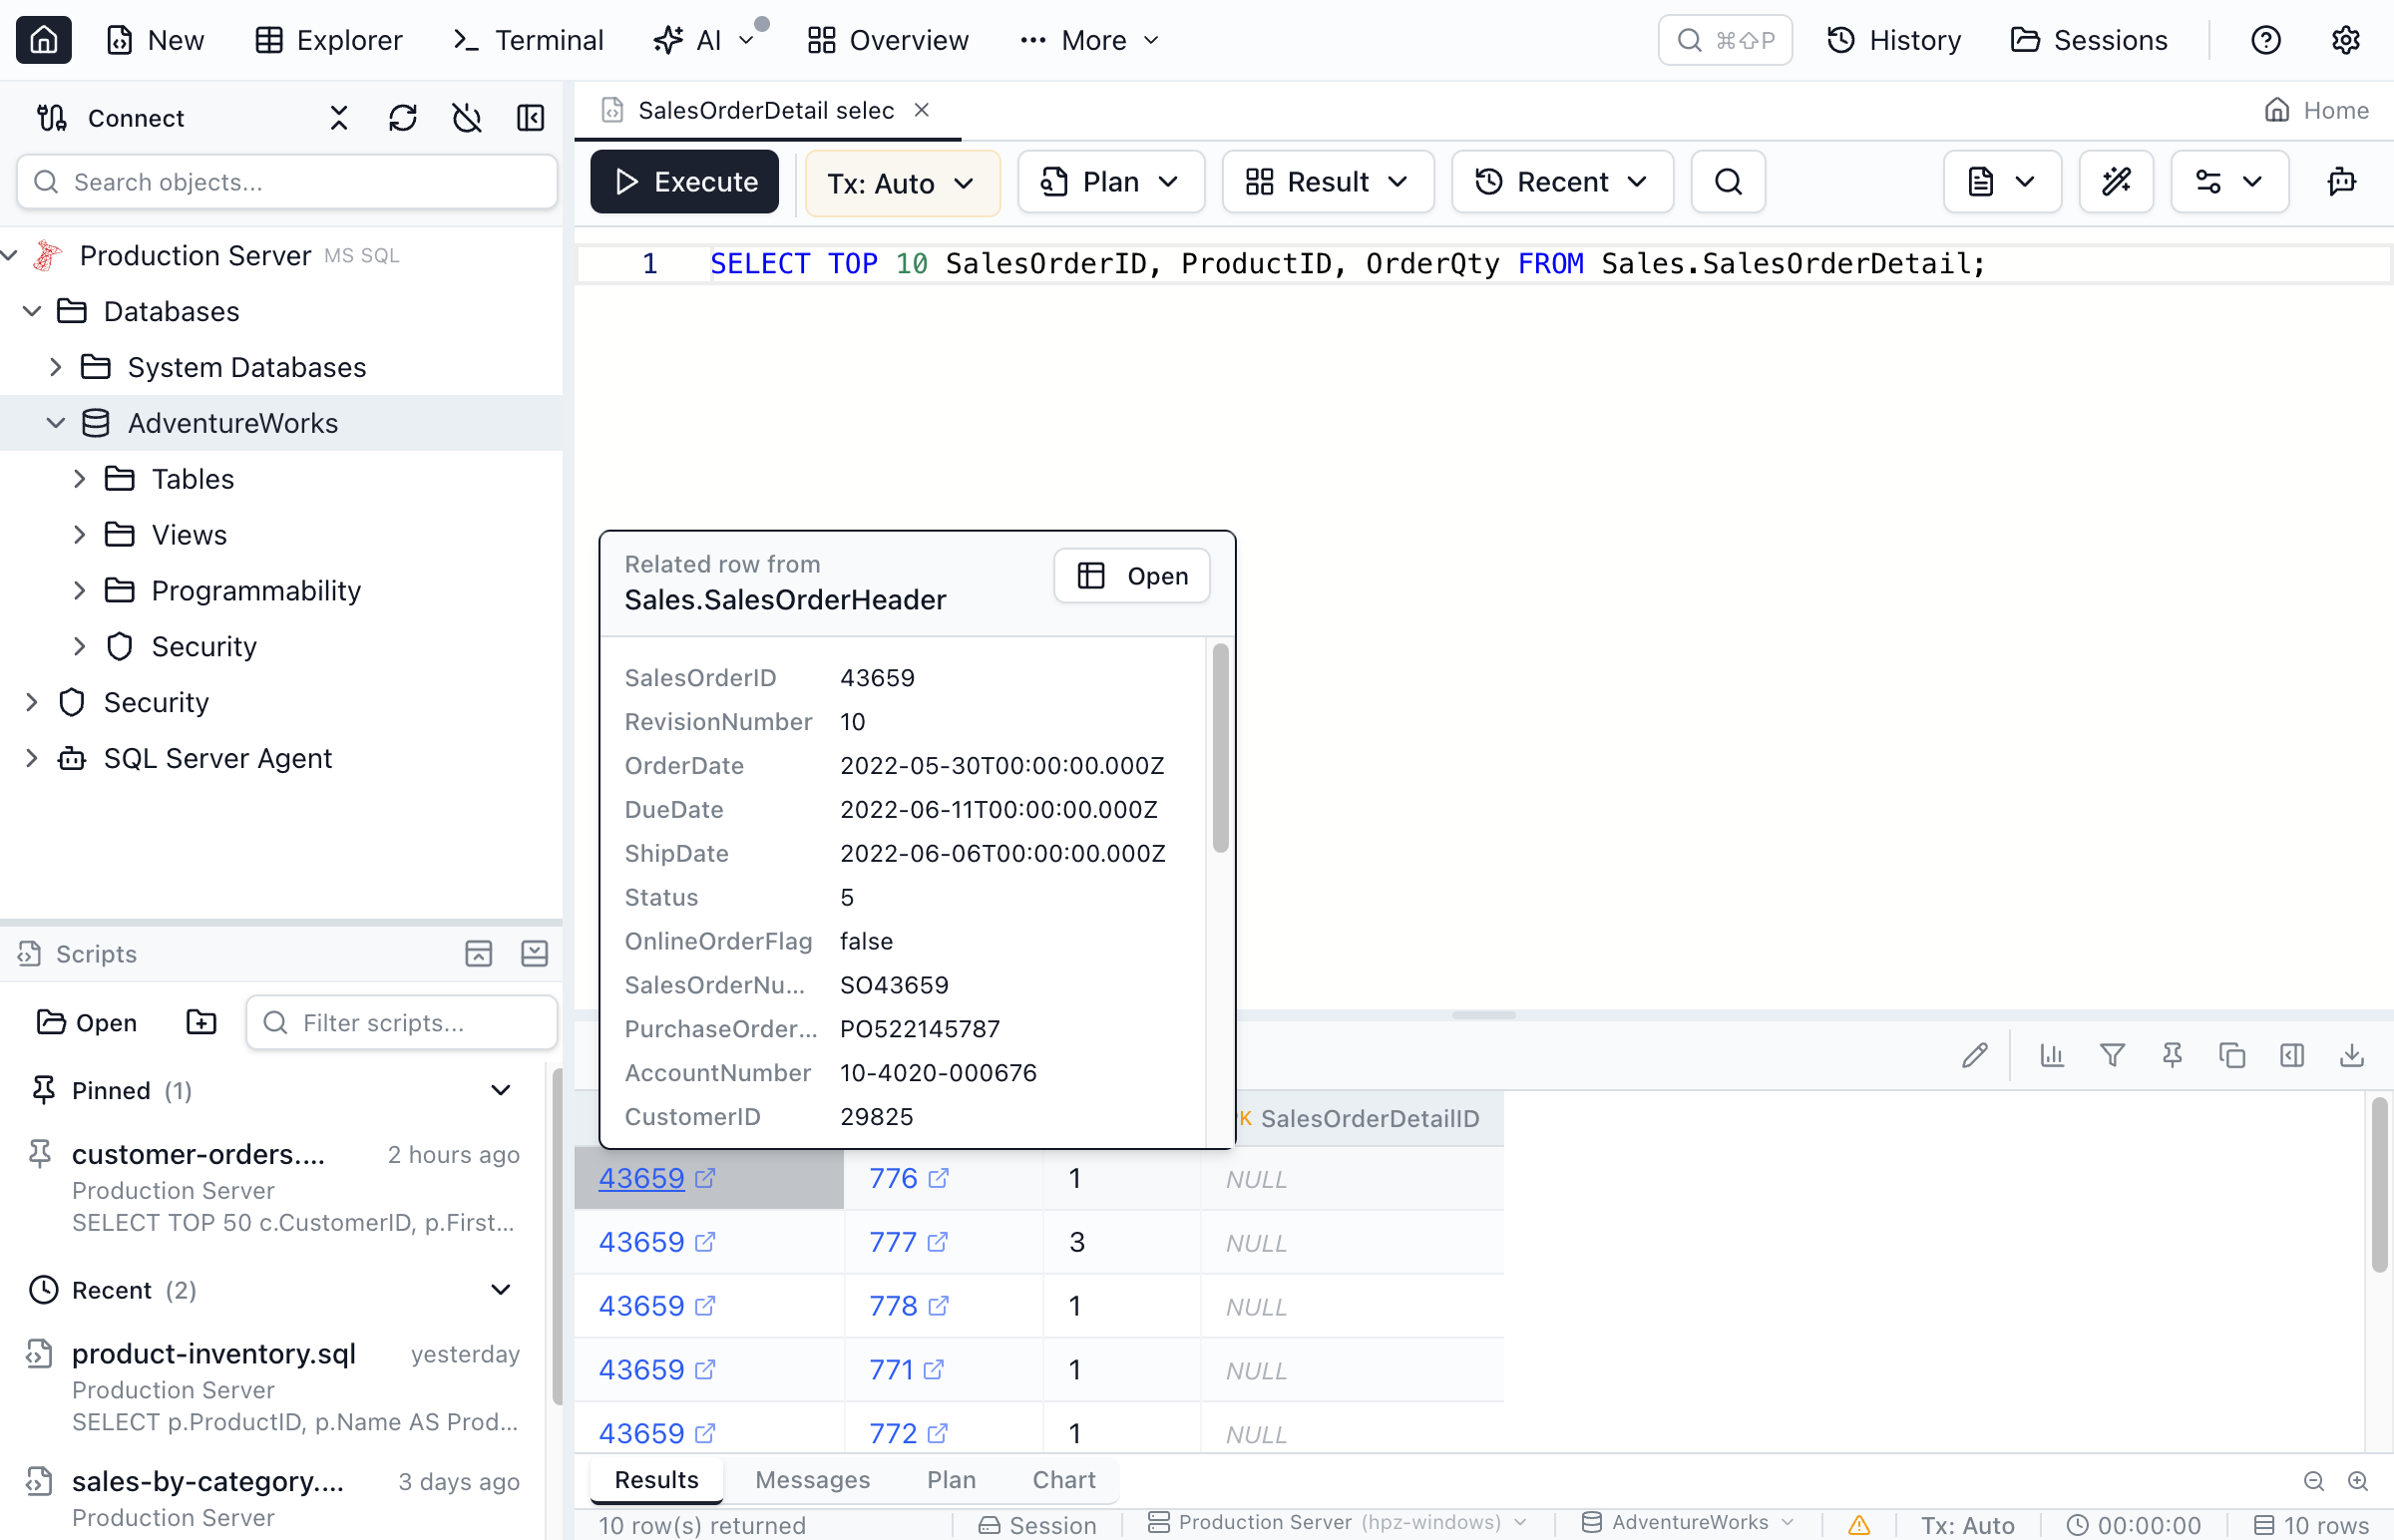
FK Navigation
Foreign key columns in query results are highlighted in blue with a link icon. Click a value to peek the referenced row and navigate to it.
- FK columns are automatically detected from query metadata — no configuration needed
- Clicking a value opens a popover showing the referenced row's data
- Click Open in the popover to jump to the referenced table in Table Explorer with the row pre-filtered
- FK constraint metadata is fetched lazily on first click and cached for subsequent lookups
- NULL values are not clickable
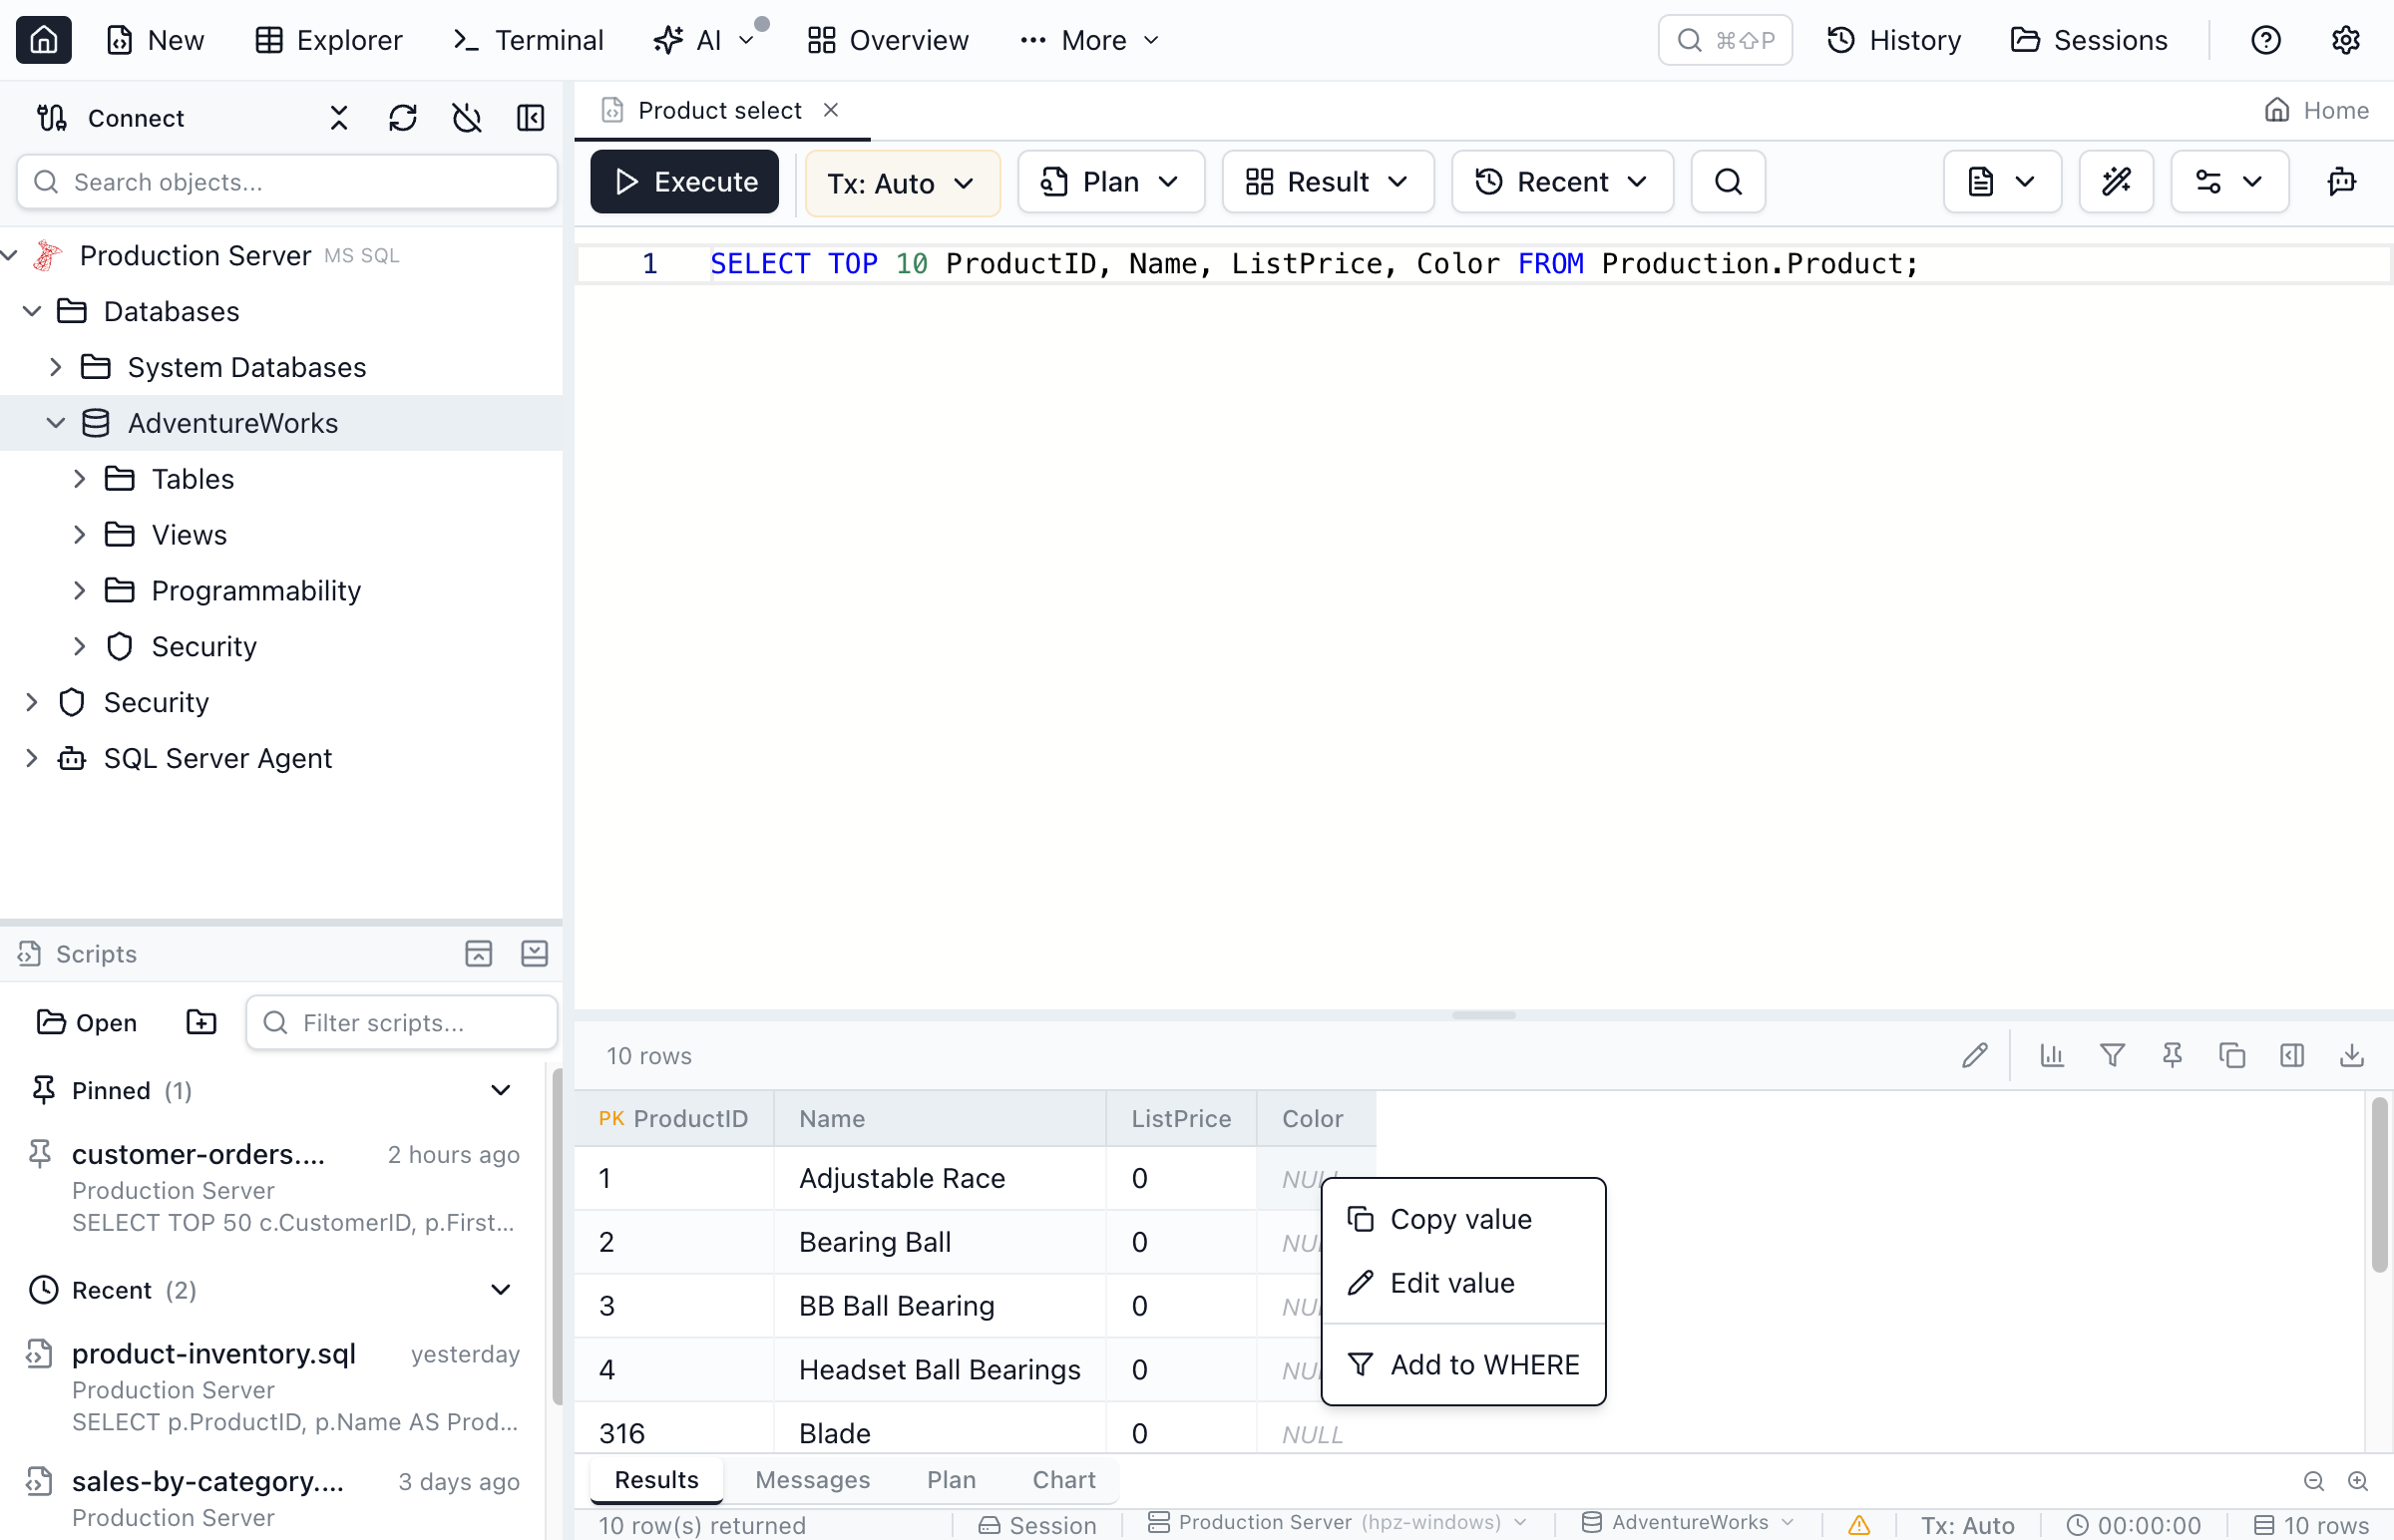
Quick WHERE Builder
Right-click any cell in the results grid and select Add to WHERE to append a filter condition to your query.
- Adds
AND column = 'value'if the query already has a WHERE clause - Inserts
WHERE column = 'value'before GROUP BY / ORDER BY if no WHERE exists - NULL values become
IS NULLconditions - Values are properly quoted and escaped for your database engine
- The query is not auto-executed — review the condition and run when ready
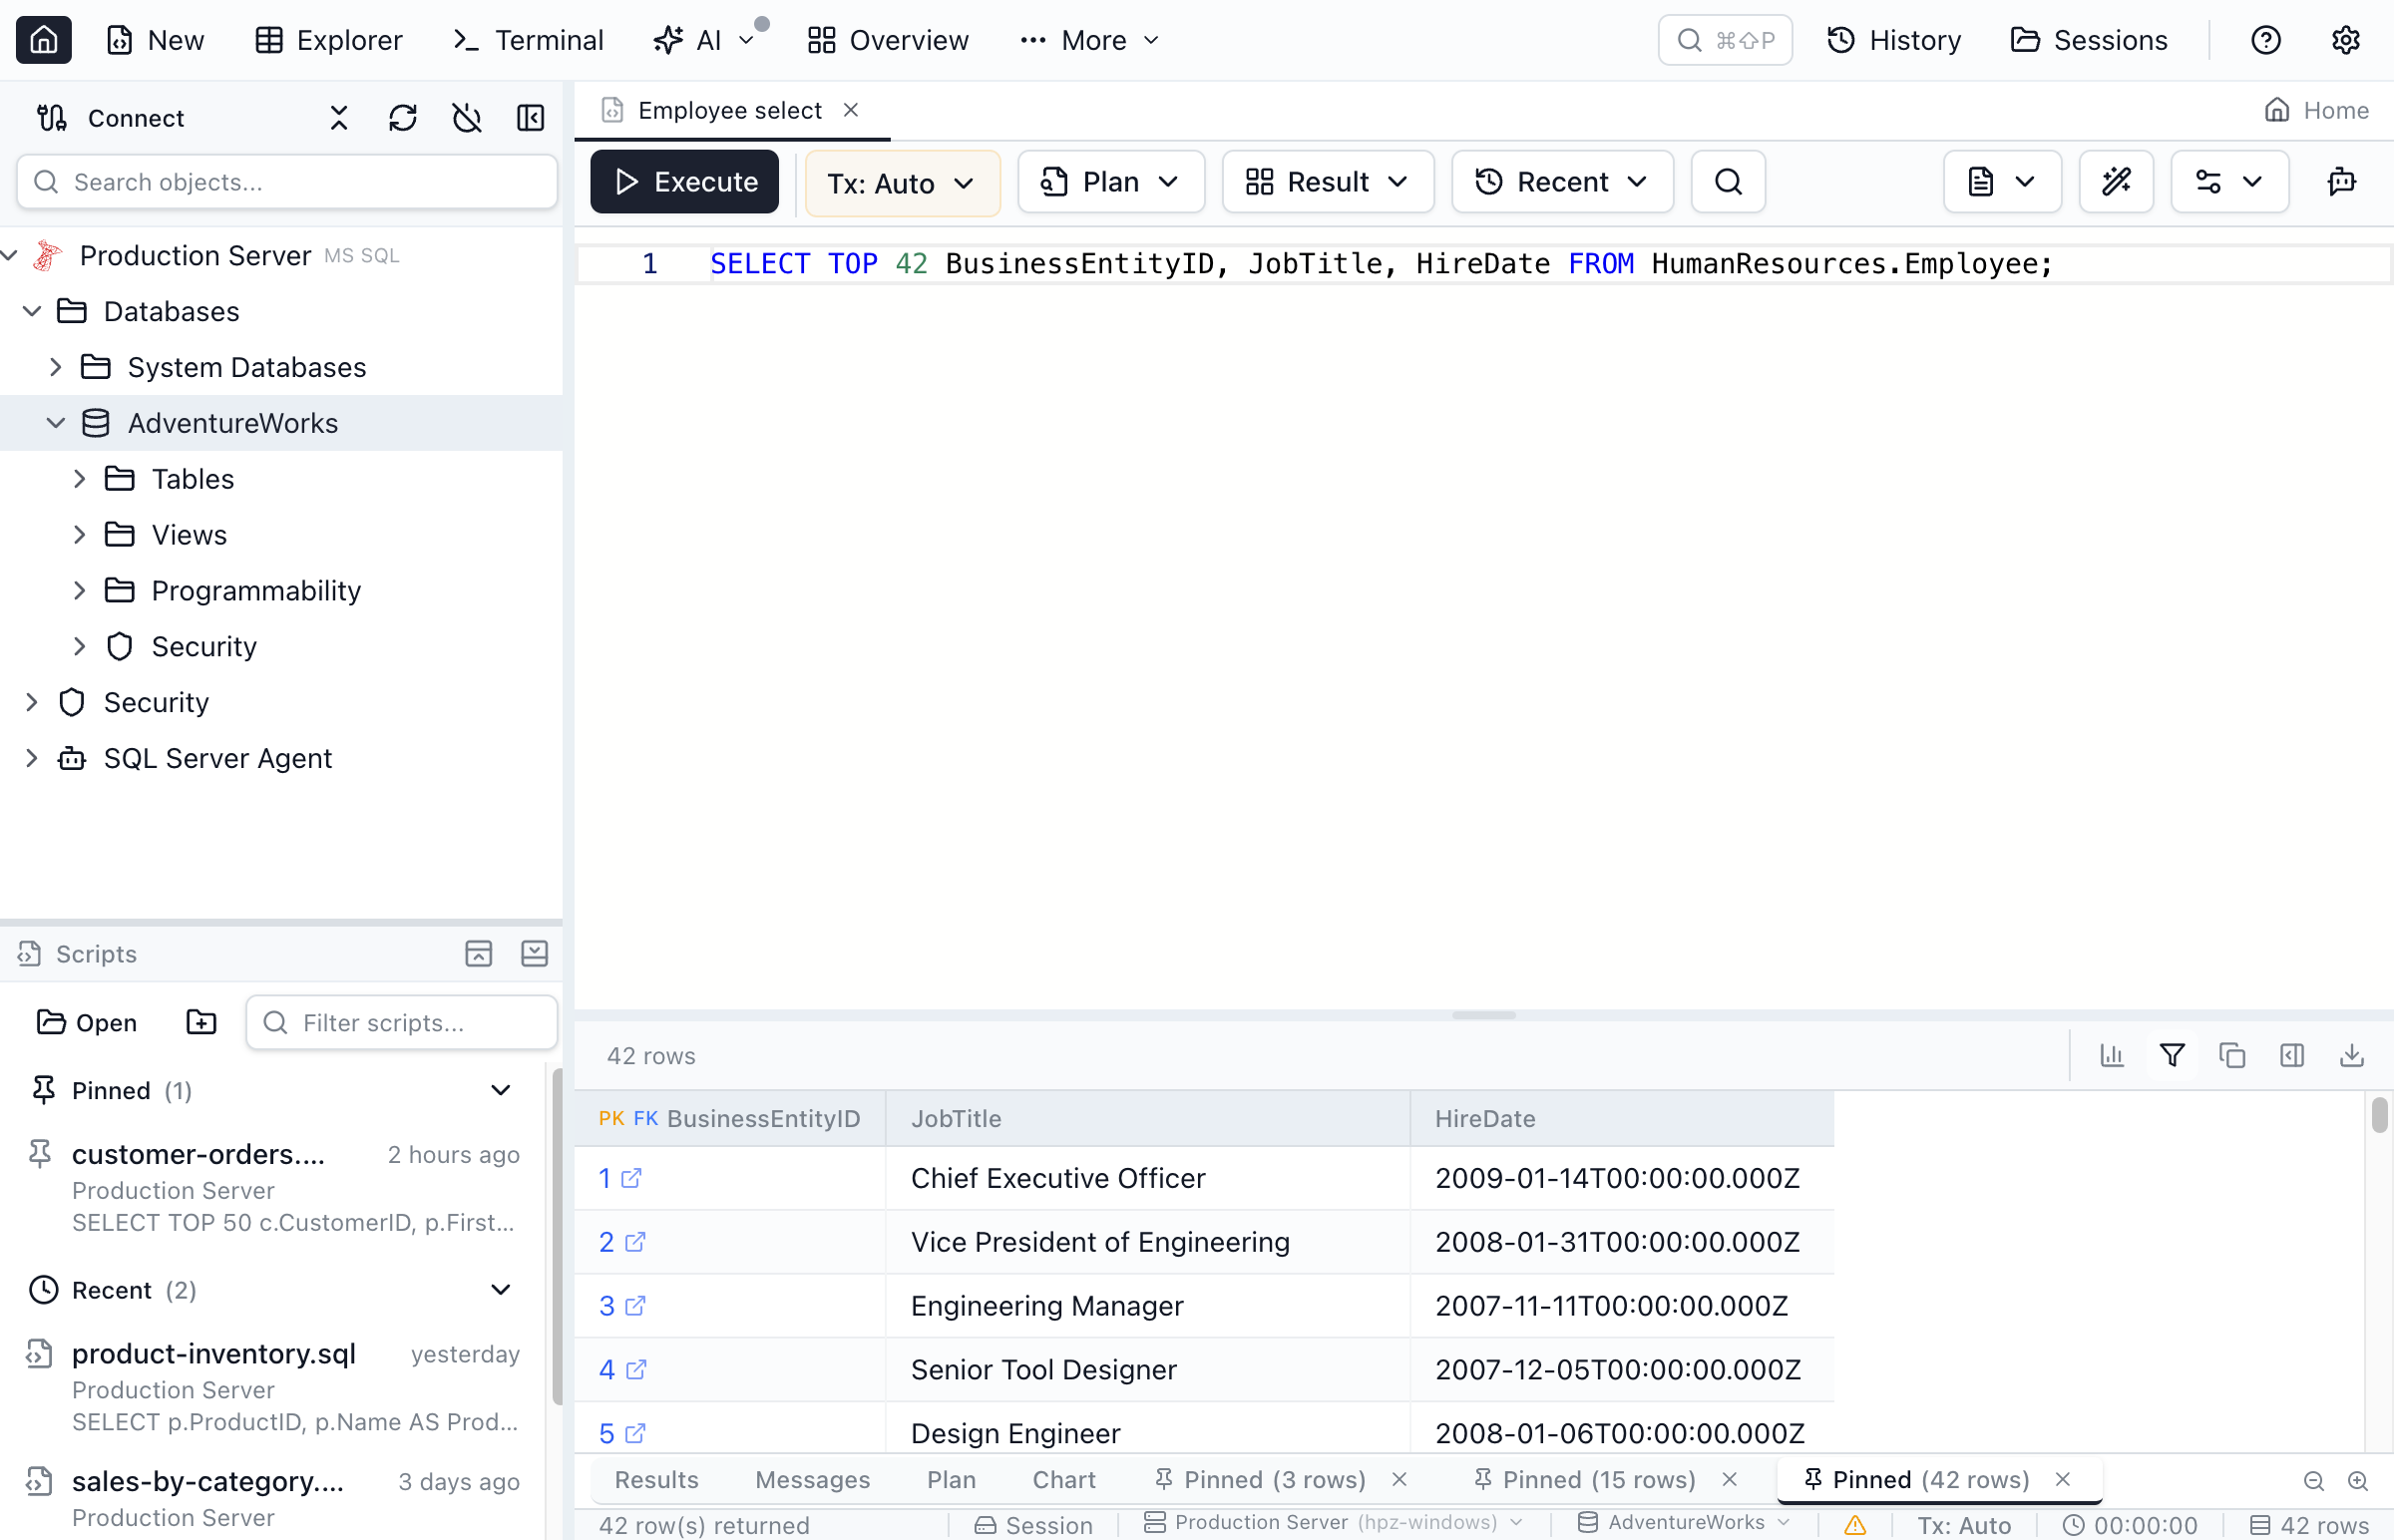
Pin Results
Pin the current result set (pin icon in the results toolbar) to create a snapshot tab that survives re-execution.
- Each pin creates a new Pinned tab with a pin icon and a close (X) button
- Pin multiple result sets — there is no limit on the number of pinned tabs
- Running a new query switches back to the Results tab; all pinned tabs stay intact
- Close a pinned tab by clicking its X button
- Pinned tabs are ephemeral — they are not saved across sessions
Editing Results (UPDATE)
For queries that return rows from a base table with a primary key, Jam SQL Studio can update cells directly in the results grid (similar to DBeaver).
- Run a SELECT query that includes the table’s primary key columns
- Click the Pencil icon in the results toolbar to enter edit mode
- Double-click an editable cell (or use the pencil icon in the row side panel) to edit
- Confirm or cancel the edit (in the row side panel, use the confirm/cancel buttons next to the input)
- Click Save to apply changes, or Discard to cancel
Notes: This supports UPDATE only (no INSERT/DELETE). Columns without a single source table (computed/aggregates) are read-only. SQLite results are not editable because the driver does not provide source table metadata. If you want to be able to rollback, make sure a transaction is active in Manual/Smart mode before applying changes; otherwise changes execute in auto-commit.
Smart inputs for enum, foreign-key, and boolean columns
When you edit a cell whose source column is a declared/native enum, a real / loose foreign key, or a boolean type, the input expands into a smart editor:
- Enum columns show a values peek with live filtering. Click a value to commit, or type free text and press
Enter— the peek is a hint, not a constraint. A settings/gear button opens the Enum values details dialog. - Foreign-key columns show a Search row in … link that opens the same row picker used by the
lookupfilter operator. Polymorphic loose FKs list one entry per matching declaration. Free text +Enterremains the always-available fallback. - Boolean columns (
bit,boolean,tinyint(1)) render an inline segmented toggle withTRUE/FALSEoptions. Nullable columns get a thirdNULLoption. Clicking an option commits immediately;Escapecancels. Free-text typing is intentionally not offered — booleans are a closed set.
The same smart inputs are applied consistently in the Table Explorer grid, its inline Row details panel, and the Single-Row Details View — so editing semantics don't change as you move between surfaces.
Plaintext View
Switch to plaintext view to see results as formatted ASCII text, useful for copying into documentation or chat.
Each execution replaces the previous plaintext output.
Large Query Results
Jam SQL Studio can display and export query results of any size — millions of rows — with no hard row cap. The app automatically chooses the optimal rendering strategy based on result size:
- Small results (≤50K rows, ≤20MB) — render instantly in the grid with client-side sorting, filtering, copy, and export. This is the same fast path used in previous versions — no change in behavior.
- Large results (>50K rows or >20MB) — use windowed virtualization. Rows stream from the backend through a sliding buffer, and the grid fetches new windows as you scroll.
When a large result set is loading:
- A progress bar shows the number of rows received so far
- You can scroll and browse partial results while they continue loading
- Click Cancel to stop population and keep the rows received so far
- Column headers are available immediately — the grid renders as soon as the first batch arrives
For large results, sort and filter operate on the full dataset via the backend (not just the loaded buffer). A brief "Sorting..." or "Filtering..." overlay appears while the operation completes. Sort and filter are not available while results are still loading — wait for population to finish.
The grid uses a proportional virtual scrollbar that maps scroll position to row index. This allows smooth navigation through millions of rows without hitting browser scroll-height limits.
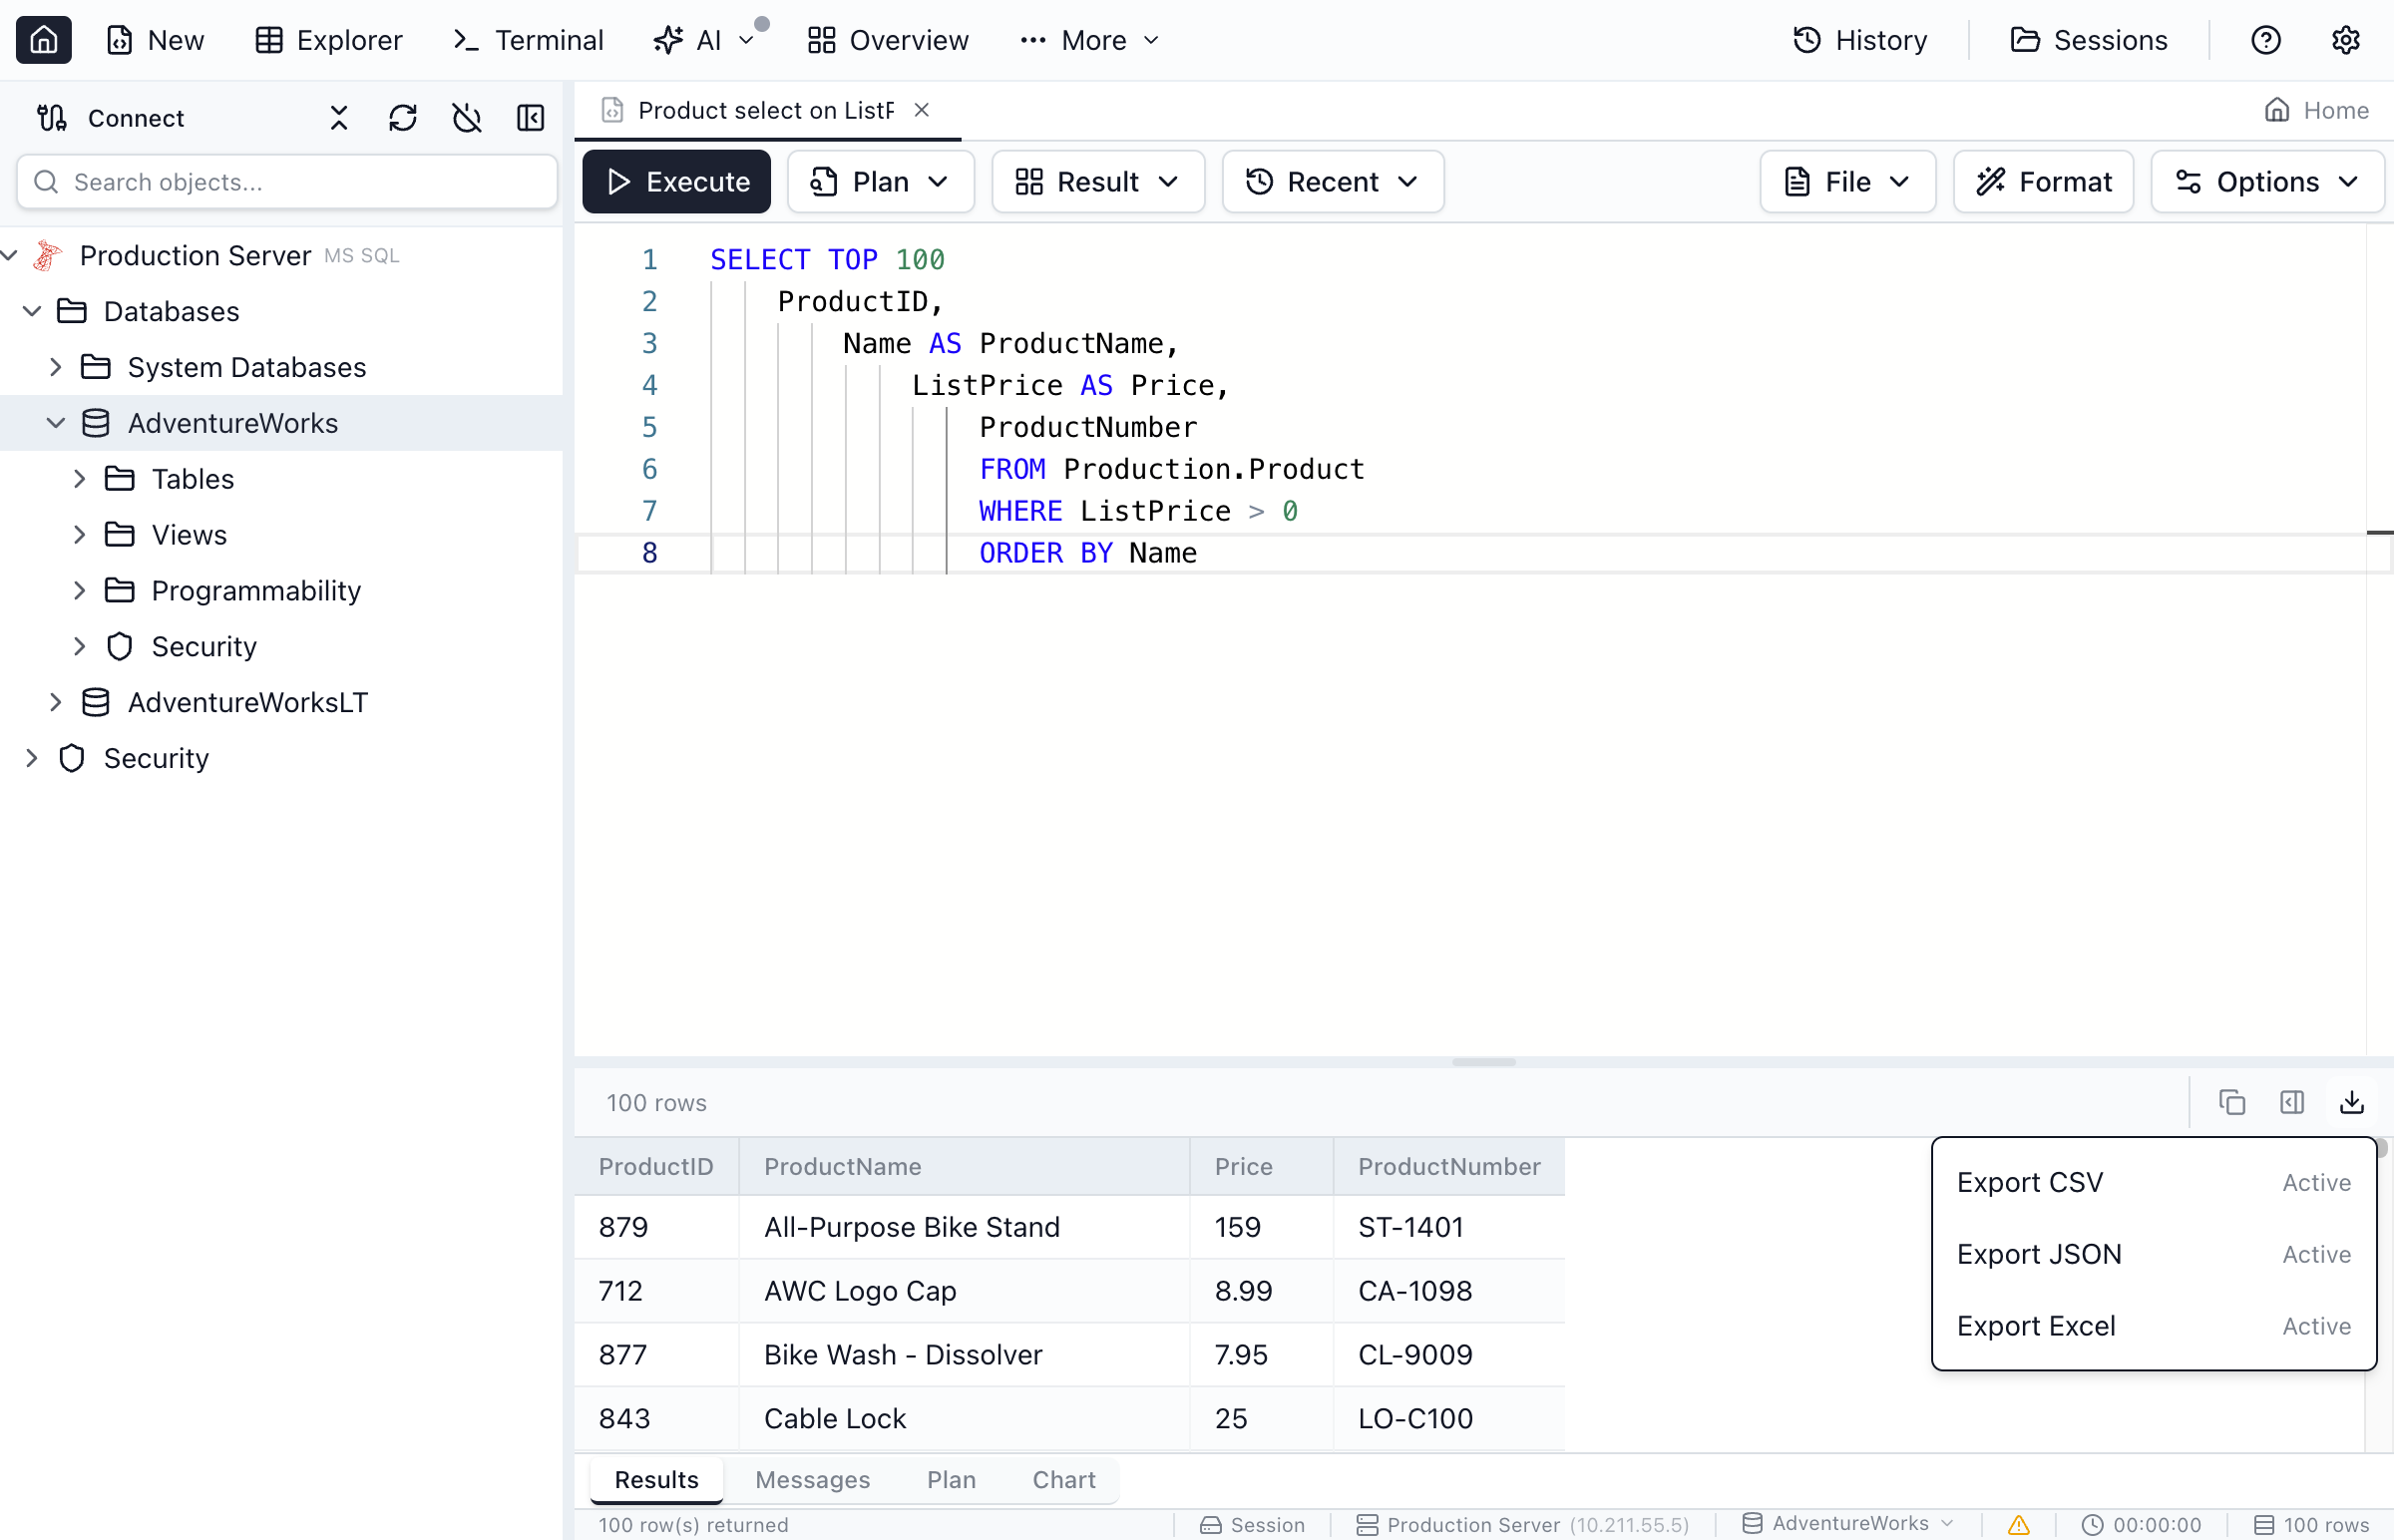
Exporting Results
Export your query results in multiple formats:
- CSV — Comma-separated values for spreadsheets
- JSON — JavaScript Object Notation for APIs
- Excel — Native .xlsx format with formatting
- SQL (INSERT) — INSERT statements as a .sql file with engine-aware identifier quoting and value formatting
You can also copy results to clipboard as CSV, Markdown, or INSERT statements from the copy dropdown in the results toolbar.
For large (windowed) result sets, use Export All to CSV to stream the full dataset to a CSV file. The export runs in the background with a progress indicator and can be cancelled. JSON, Excel, and SQL INSERT exports are available only for small (in-memory) results.
Transaction Management
Control how your queries interact with transactions using the toolbar controls. Each query tab has its own independent transaction state.
In Manual and Smart mode, transaction controls are grouped with a subtle shared tint: transaction mode and isolation sit on the first row, and commit/rollback controls sit on the second row.
When the toolbar gets narrow, right-side File/Format/Options collapse first; if space is still tight, Plan/Result/Recent collapse to icon-only buttons.
With two-row transaction controls visible, right-side actions move into that second row beside commit/rollback only after File/Format/Options and Plan/Result/Recent have already collapsed and space is still insufficient.
Transaction Modes
Click the transaction mode button in the toolbar to switch between three modes:
- Auto (default) - Every statement auto-commits immediately. This is the standard behavior.
- Manual - A transaction begins automatically on your first query. You decide when to commit or rollback using the toolbar buttons.
- Smart - Read-only queries (SELECT) run in auto-commit, while data-modifying statements (INSERT, UPDATE, DELETE) automatically begin a transaction.
Commit and Rollback
When a transaction is active in Manual or Smart mode, use the toolbar buttons or keyboard shortcuts:
- Commit - Save all changes in the current transaction (
Cmd+Shift+C/Ctrl+Shift+C) - Rollback - Discard all changes in the current transaction (
Cmd+Shift+R/Ctrl+Shift+R)
If no transaction is active yet, the toolbar shows a short hint telling you to run a query first to start one.
The status bar shows the current transaction state with color indicators: amber for an active transaction, red for an error state.
Isolation Levels
In Manual or Smart mode, you can set a transaction isolation level per tab:
- Default - Use the database engine's default level
- Read Uncommitted - Allows dirty reads
- Read Committed - Prevents dirty reads (SQL Server and PostgreSQL default)
- Repeatable Read - Prevents non-repeatable reads
- Serializable - Full isolation (SQLite only supports this level)
The isolation level applies when the next transaction begins. Changing it during an active transaction takes effect on the next one.
Tab Close Safety
If you try to close a tab with an active transaction, a dialog gives you three choices: Commit and Close, Rollback and Close, or Cancel. When the app quits, all active transactions are rolled back automatically.
The query status bar uses compact 12px text for improved readability during long editing sessions.
Editor Options
Customize the query editor to match your preferences.
Formatting
- Format SQL - Press
Shift+Alt+Fto format your SQL code - Word wrap - Toggle word wrap for long lines
- Tab size - By default, pressing Tab in the query editor inserts 2 spaces. You can change this to 4 or 8 in Settings → UI → Editor → Tab Size. The choice is global and persists across restarts. It applies to the main query editor and the PL/SQL debugger edit view.
File Operations
- Open file -
Cmd+O/Ctrl+Oto open a .sql file - Save file -
Cmd+S/Ctrl+Sto save - Save as -
Cmd+Shift+S/Ctrl+Shift+Sto save with a new name
File-backed tabs show an asterisk (* filename.sql) in the tab title when there are unsaved changes. The indicator disappears after saving.
Scripts Panel
Use the Scripts panel in the sidebar to manage and reopen your .sql files:
- Recent - Quickly reopen recently opened scripts
- Pinned - Pin frequently used scripts for each script workspace
- Mounted folders - Mount a folder from disk and browse .sql files in a tree
- Rename mounted folders - Right-click a mounted folder and choose Rename in Jam SQL (label only)
- Filter scripts - Search across Recent/Pinned and mounted folders
When you open a script from the Scripts panel, Jam SQL Studio uses your current connection context from Object Explorer. If no connection is selected, you'll be prompted to choose one.
AI Chat Sidebar
The Query Editor includes a built-in AI Chat sidebar powered by your locally installed Claude CLI or Codex CLI. Click the AI button in the toolbar to open the chat panel alongside your editor.
- Ask questions about your SQL, get suggestions, and let the AI interact with your database via MCP tools
- The AI can update your editor directly using the
ui_set_editor_texttool - @-mentions — type
@to reference database objects (tables, views, procedures) from the Object Explorer - Session continuity — conversations persist across tab switches and session restores
- Multi-backend — supports both Claude CLI and Codex CLI; switch between them with a segmented control when both are installed
See AI Integrations & MCP for setup details.
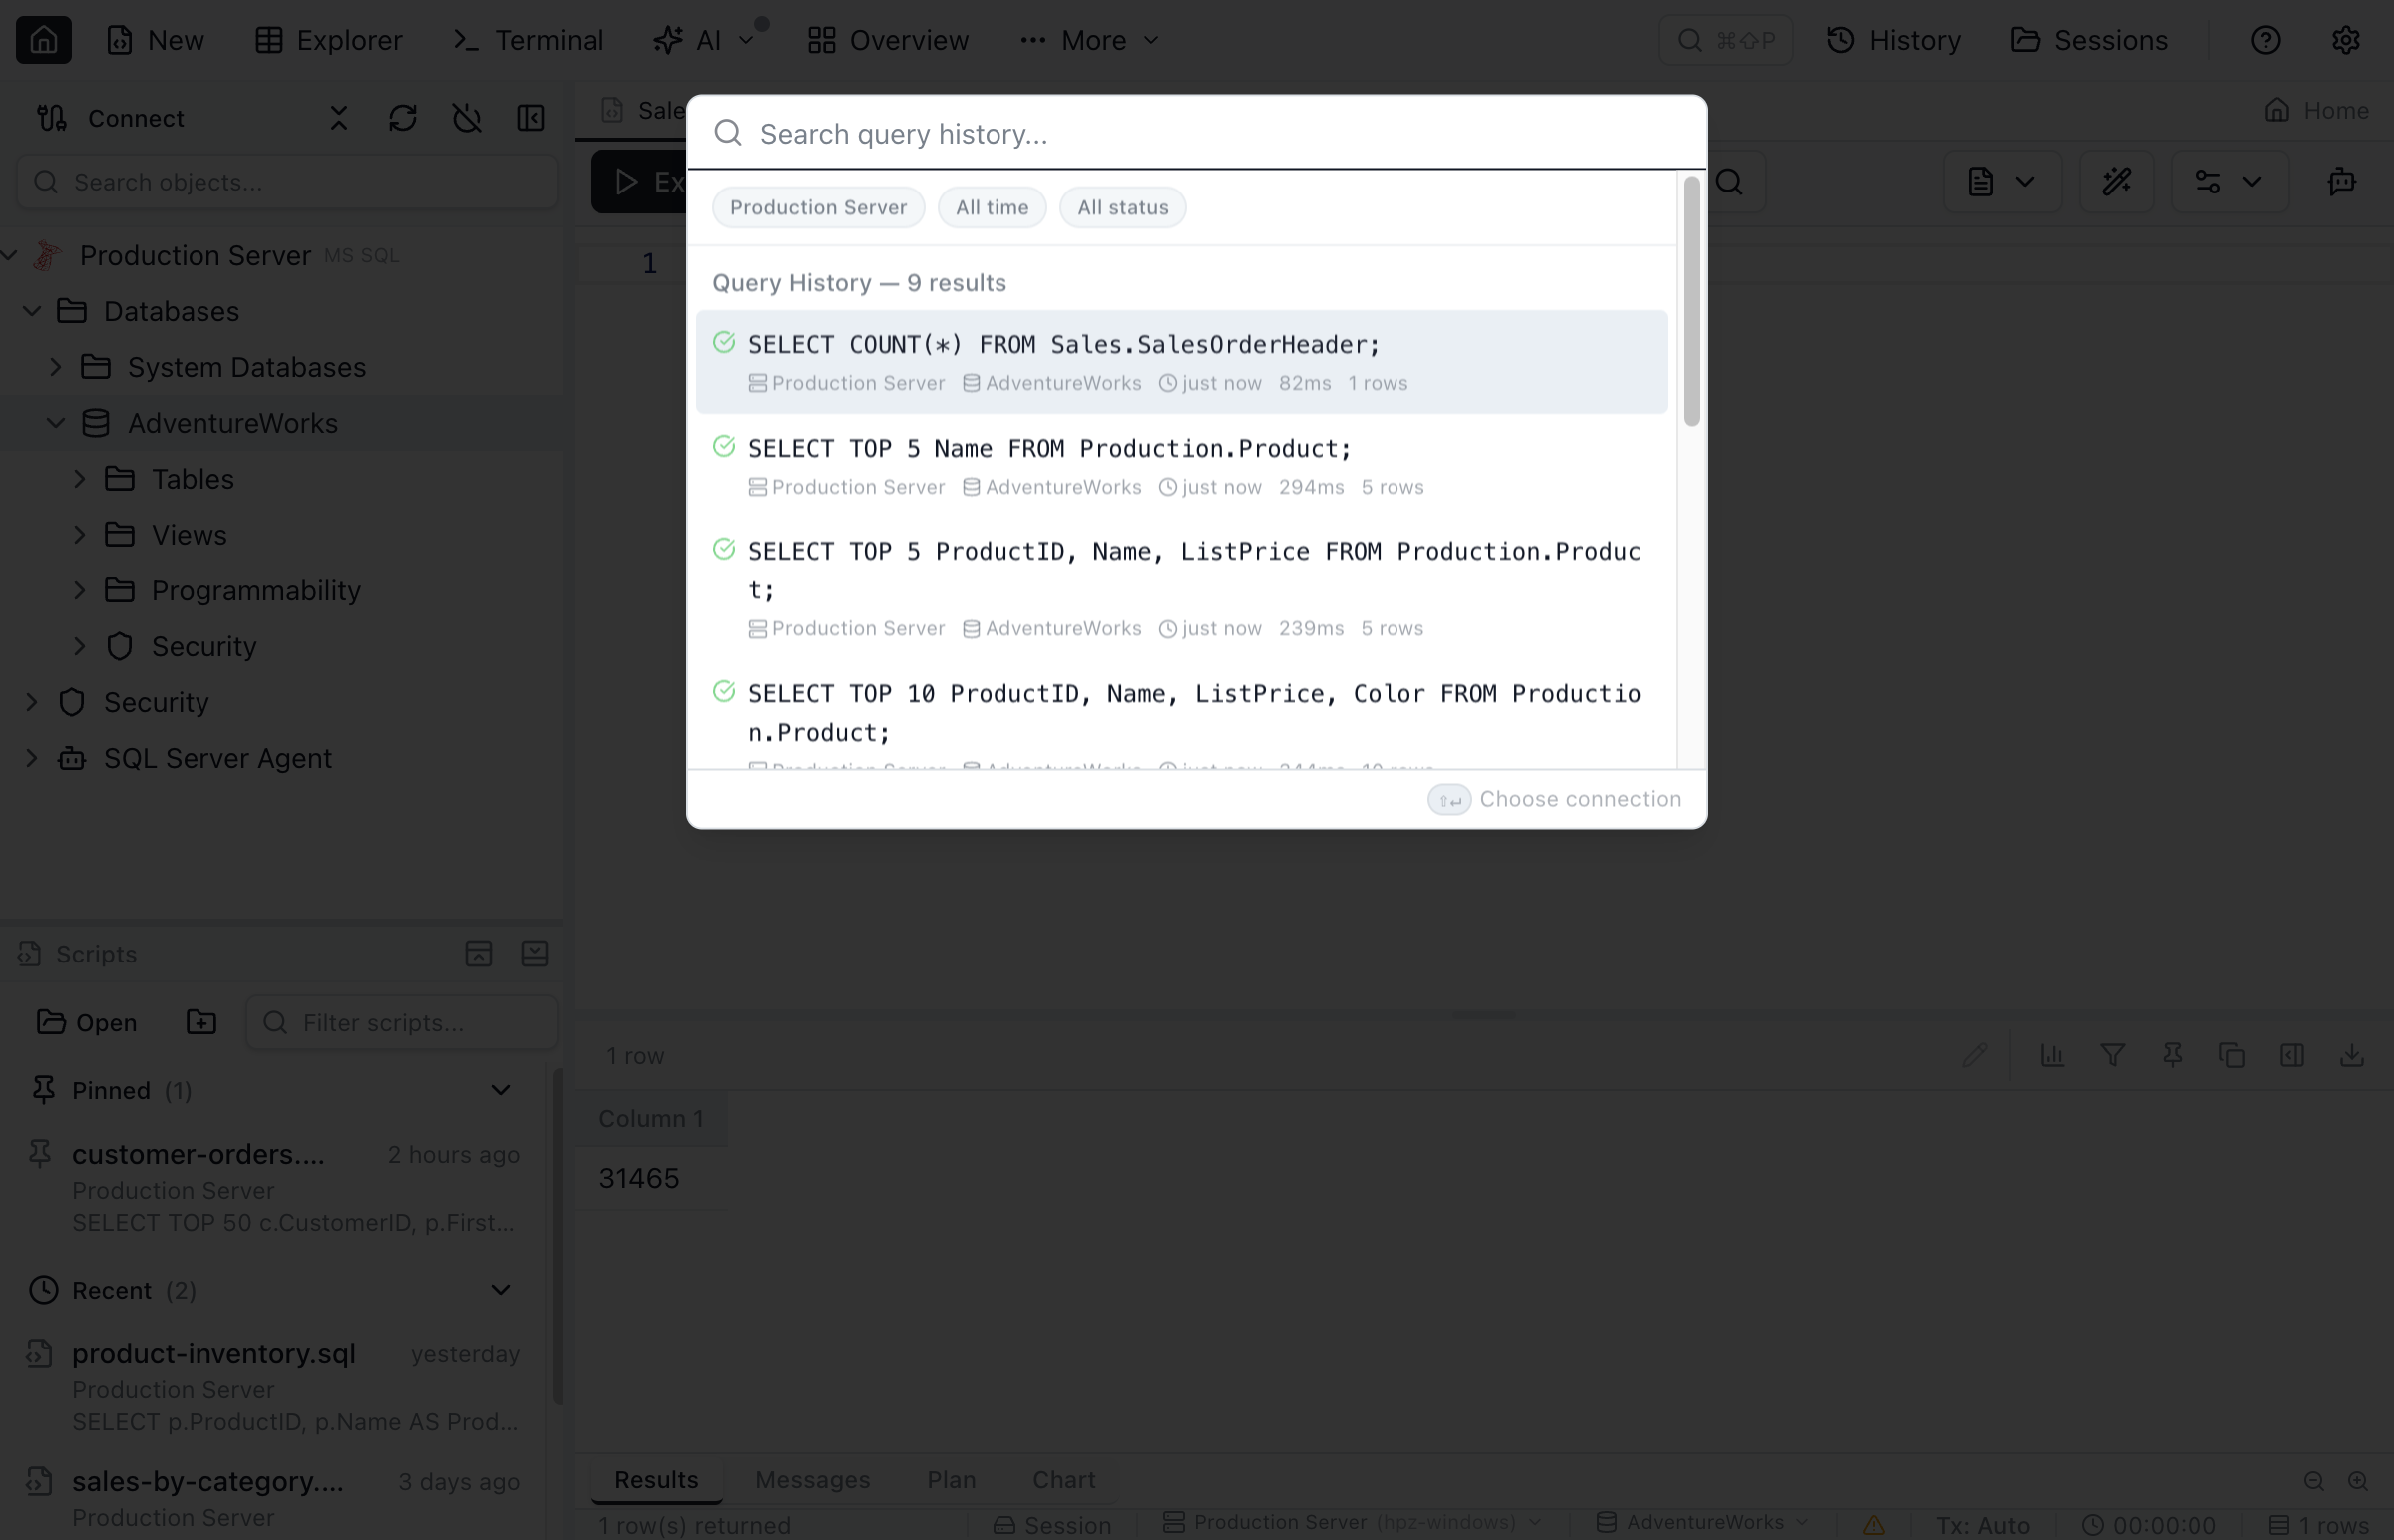
Query History Search
Search across all your query history with full-text search and filters. Open it via:
- Keyboard shortcut —
Cmd+Shift+Y(macOS) /Ctrl+Shift+Y(Windows/Linux) - Command Palette — type "history" and select "Search Query History"
- Toolbar button — click the history search icon in the query toolbar
Filter results by connection, database, success/error status, and date range (today, last 7 days, last 30 days, or all time). Results show the SQL preview, connection name, timestamp, duration, and row count.
Click a result to insert its SQL into the current editor. Up to 200 queries are stored per connection/database context.
Keyboard Shortcuts
Master these shortcuts to work faster in the query editor:
| Action | macOS | Windows/Linux |
|---|---|---|
| Execute query | F5 | F5 |
| Cancel query | Escape | Escape |
| Format SQL | Shift+Alt+F | Shift+Alt+F |
| Open file | Cmd+O | Ctrl+O |
| Save file | Cmd+S | Ctrl+S |
| New query tab | Cmd+T | Ctrl+T |
| Close tab | Cmd+W | Ctrl+W |
| Comment line | Cmd+/ | Ctrl+/ |
| Find | Cmd+F | Ctrl+F |
| Find and replace | Cmd+H | Ctrl+H |
| Search query history | Cmd+Shift+Y | Ctrl+Shift+Y |
| Copy selected cells | Cmd+C | Ctrl+C |
| Commit transaction | Cmd+Shift+C | Ctrl+Shift+C |
| Rollback transaction | Cmd+Shift+R | Ctrl+Shift+R |
| Toggle Results Pane | Cmd+J | Ctrl+J |
Frequently asked questions
How do I execute a SQL query in Jam SQL Studio?
Press F5 or click the Execute button in the toolbar to run all queries in the editor — both always run the full editor content. To execute only a portion, select the text and click the floating Execute button that appears next to your selection.
Does Jam SQL Studio have SQL autocomplete?
Yes, Jam SQL Studio provides IntelliSense with context-aware suggestions for table names, column names, SQL keywords, and functions based on your database schema.
How do I export query results?
Click the Export button in the results toolbar and choose your format: CSV, JSON, or Excel (.xlsx). For JSON and Excel, you can export the active result set or all result sets.
Can I view the execution plan for my query?
Yes, click the Execute dropdown and select 'Execute with Actual Plan' or 'Execute with Estimated Plan'. The execution plan opens in a visual tree/graph view for analysis.
How do I cancel a running query?
Click the Stop button in the toolbar or press Escape while a query is running. The query will be cancelled on the server side.
Ready to Write Queries?
Download Jam SQL Studio and start writing SQL with powerful IntelliSense.