
Last updated: 2026-09-23
Execution Plans
Visualize SQL execution plans to understand how the database engine processes your queries. Identify performance bottlenecks, compare plans, and optimize slow queries with interactive graphical analysis.
Getting Started
Execution plans show the step-by-step operations the database uses to execute your query. Understanding these plans is essential for query optimization and performance tuning.
How to View an Execution Plan
- Open a query editor with your SQL statement on a SQL Server, PostgreSQL, MySQL or Oracle connection
- Open the Plan menu in the query editor toolbar and choose Explain plan to capture the estimated plan without running the query
- Or choose Execute with actual plan to run the query and capture the actual plan
- The plan opens in the Plan tab of the results pane as an interactive diagram you can explore
Estimated plans show what the optimizer predicts. Actual plans show what really happened, including row counts and execution times. Use actual plans for accurate performance analysis.
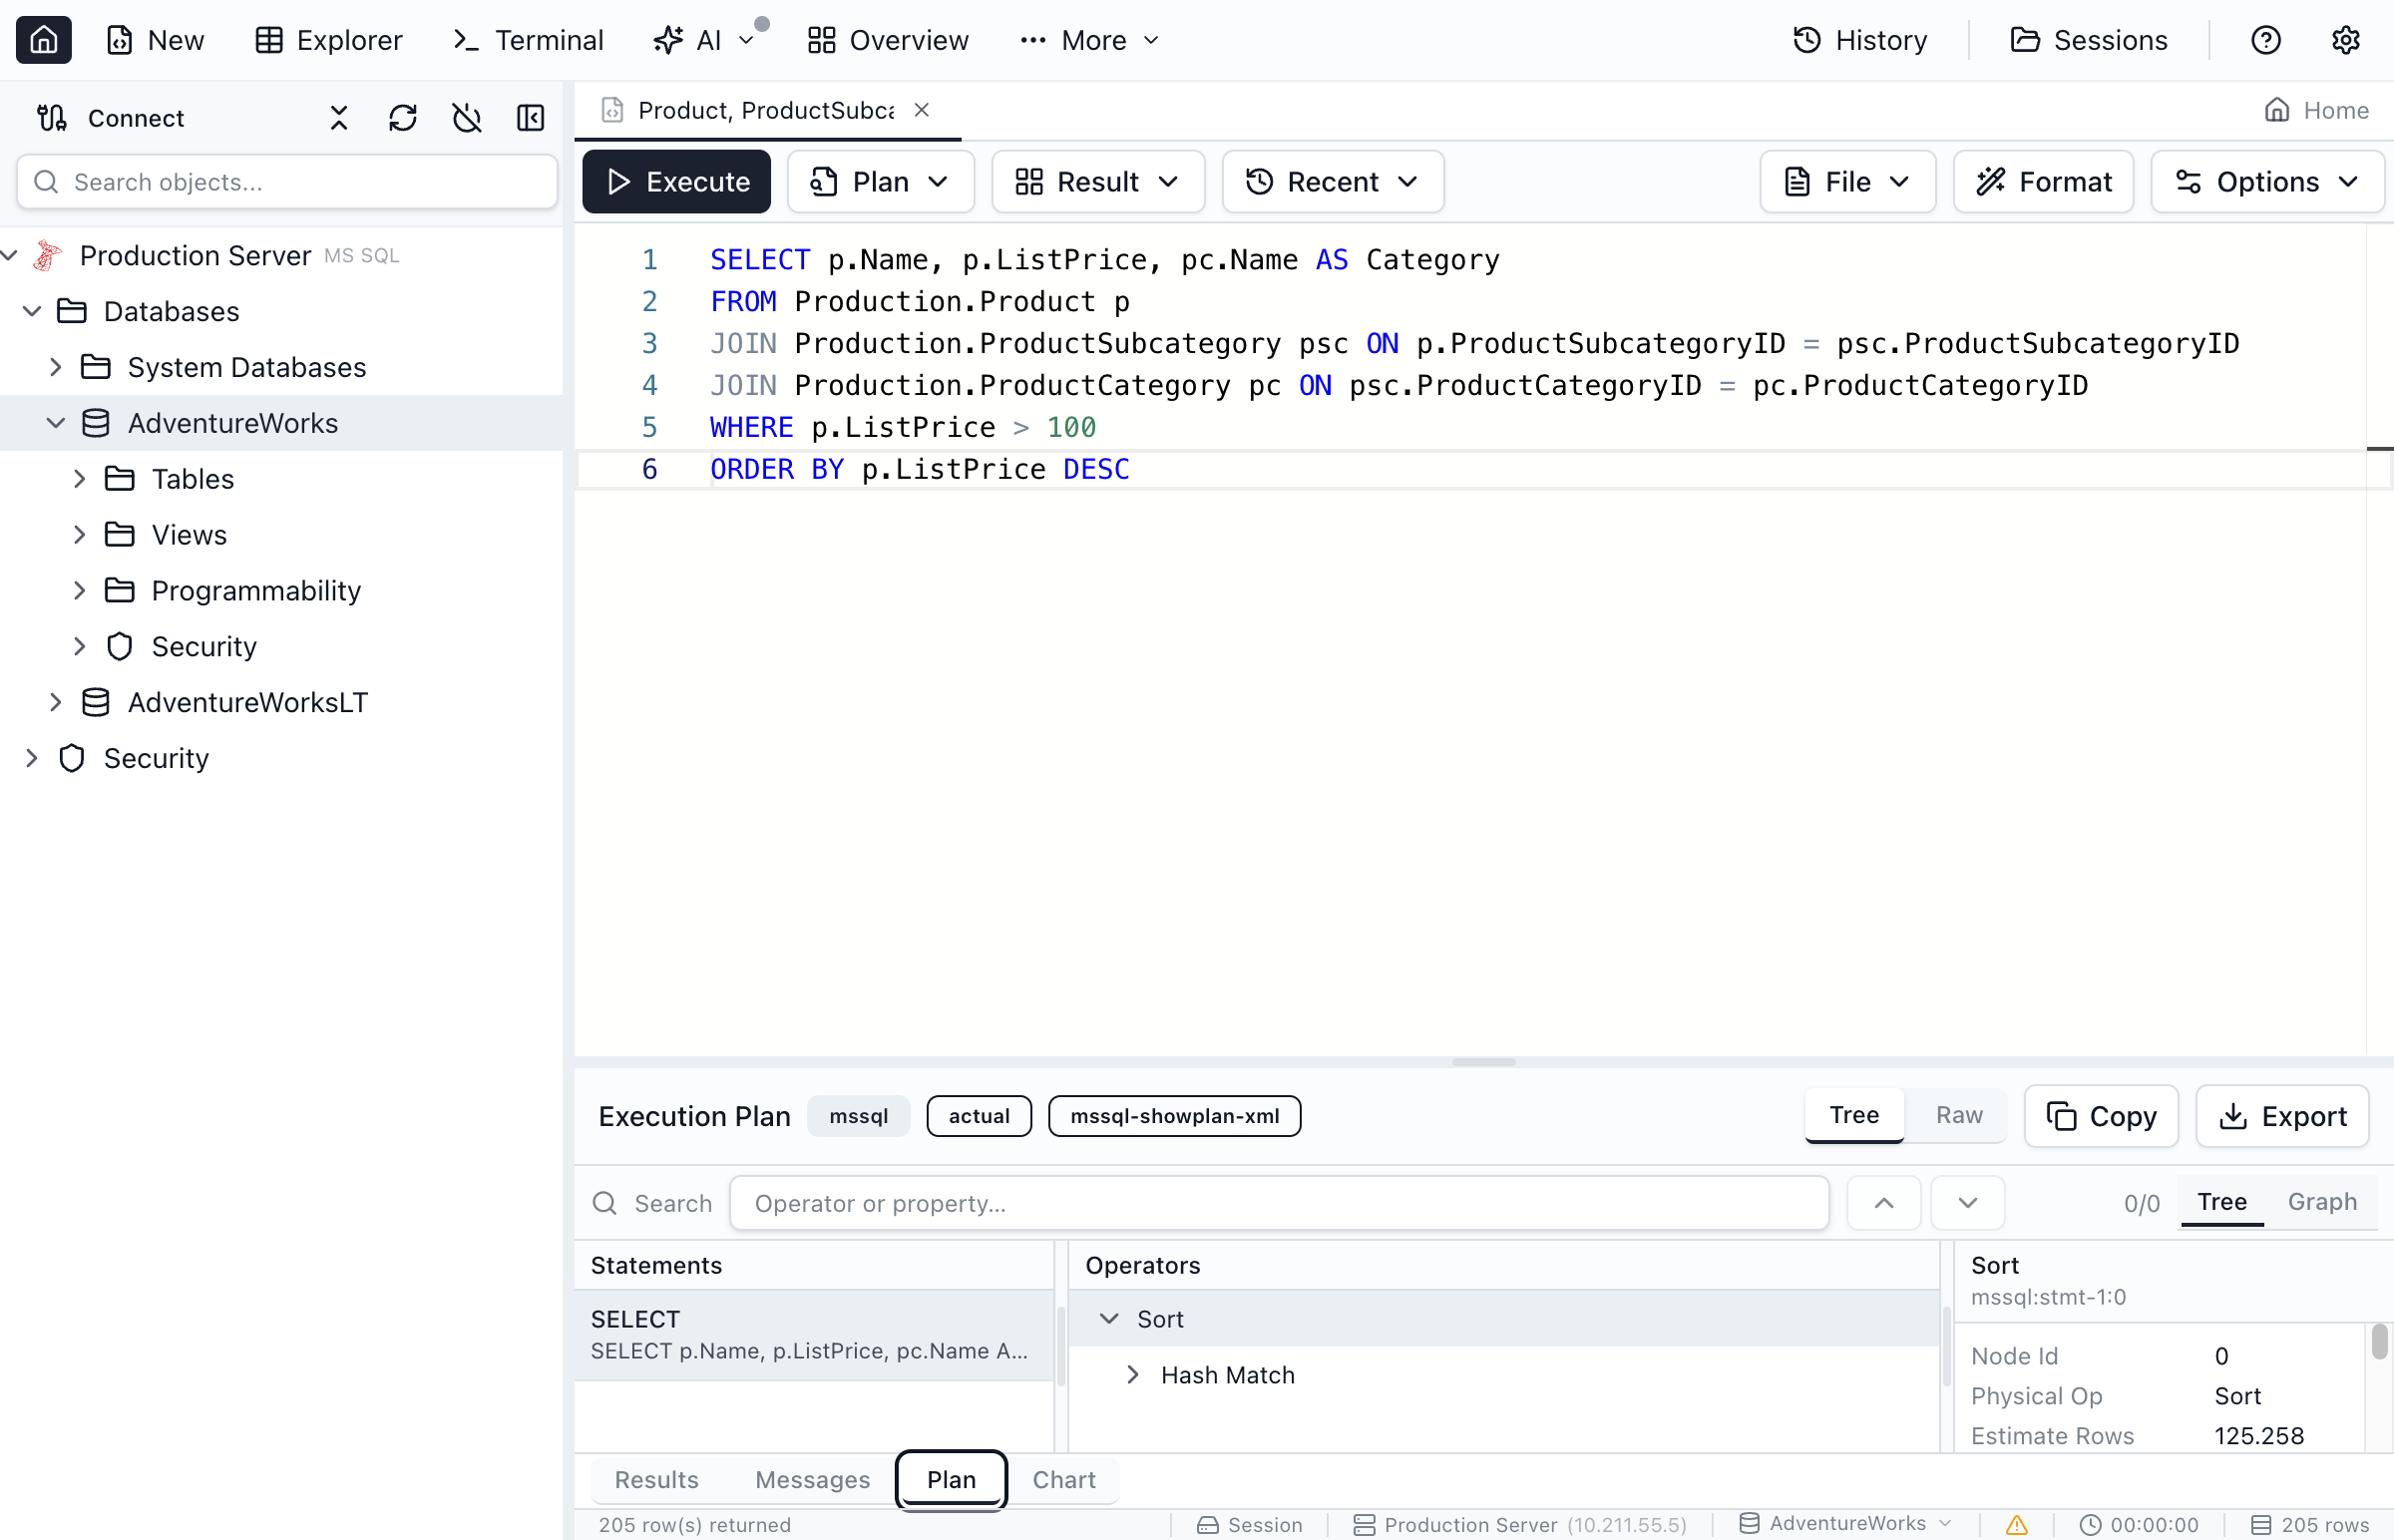
Understanding the Plan Diagram
The execution plan is drawn top-down: the root operator, which returns the statement's rows, is at the top, and the operators it reads from are below it, down to the table and index access at the bottom. Rows flow upwards. Each node represents an operation, and the lines connect each operator to its inputs.
Reading Operator Nodes
Each operator node shows:
- Operator name - the physical operator (SQL Server), node type (PostgreSQL), access type or iterator (MySQL), or operation and options (Oracle)
- Table - the object the operator reads, under the name, on SQL Server and PostgreSQL plans
- Cost percentage badge - the operator's estimated subtree cost (the operator plus everything below it) as a share of the statement's root operator, on SQL Server and PostgreSQL plans
- Warning badge (
!2) - the number of warnings SQL Server recorded on that operator'sRelOp, such asSpillToTempDborNoJoinPredicate. Statement-level items (MissingIndexes,PlanAffectingConvert) are not read.
The lines between operators have a fixed width. Row estimates and actual rows, costs and the operator's other properties are in the details panel: select an operator to see them.
Common Operator Types
Table Scan
Reads entire table. Consider adding indexes for large tables.
Index Seek
Efficient lookup using an index. This is what you want to see.
Nested Loops
Joins by looping through rows. Efficient for small datasets.
Hash Match
Builds hash table for joins. Efficient for large datasets.
Sort
Orders result rows. Memory-intensive for large results.
Key Lookup
Fetches additional columns. May indicate need for covering index.
Comparing Execution Plans
Plan comparison helps you understand how query changes or index modifications affect performance.
How to Compare Plans
- Capture the first plan with Explain plan or Execute with actual plan, then click Export in the plan toolbar to save it to a file (the formats are listed under Frequently asked questions)
- Make your change (rewrite the query, add an index, update statistics) and capture the new plan
- Open the exported file with More > Open Execution Plan in the main toolbar, or Open Execution Plan in the command palette. The plan opens in its own plan tab
- Click Compare in the plan tab's toolbar. The plan in the tab becomes the Baseline
- In the Compare list, pick the new plan. Both lists offer every plan captured in an open query tab and every plan open in a plan tab; Import next to a list loads a plan file instead, and the arrow button between the lists swaps the two sides
- Read the summary above the two panes: how many operators were added and removed, how many matched operators changed type (Label), Cost or Rows, and the root cost and root rows before and after. Each pane has its own Tree and Graph view. Single leaves the compare view
Both plans must have the same format. SQL Server operators are matched by NodeId, the other engines' operators by their position in the tree. On SQL Server, the Query Store tab's Compare plans button opens two stored plans of the same query in this view directly.
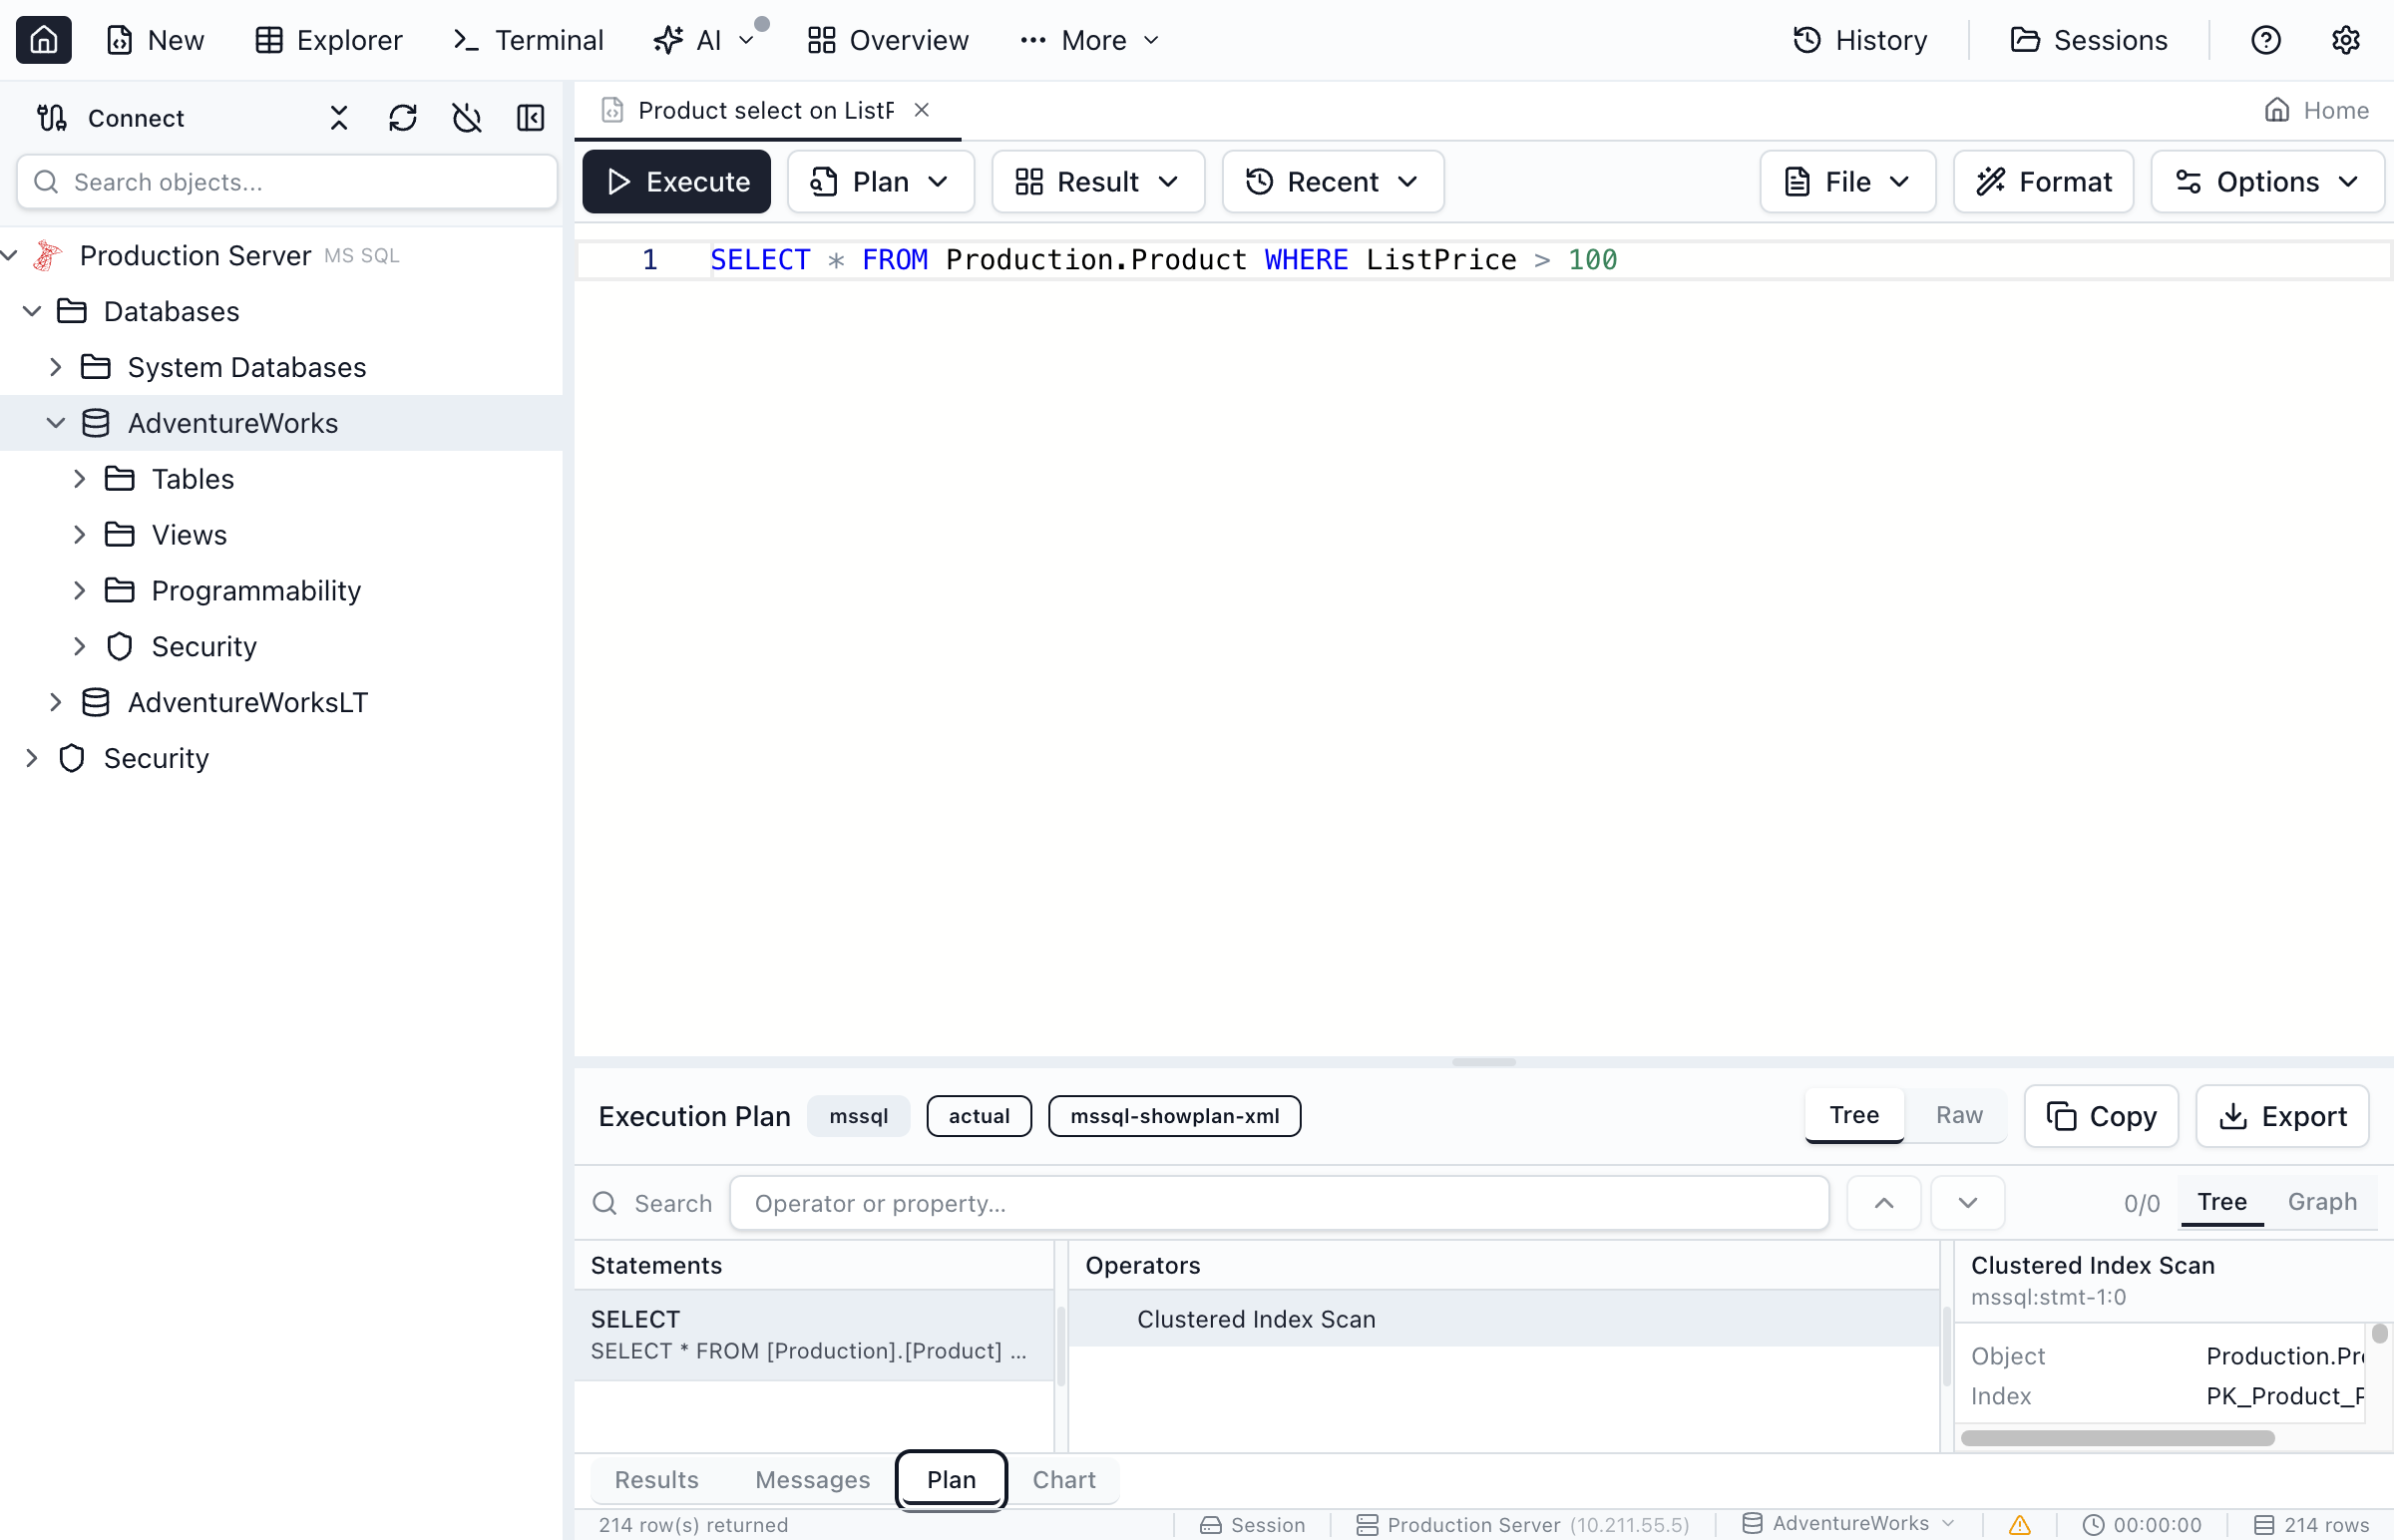
Key Capabilities
- Interactive diagram - Click operators to see detailed properties
- Cost breakdown - See which operations are most expensive
- Plan comparison - Compare before/after to validate optimizations
- Export plans - Save plans to files that open again in Jam SQL Studio; SQL Server plans as
.sqlplan
A teammate who doesn't have Jam SQL Studio installed can open an exported SQL Server .sqlplan, PostgreSQL EXPLAIN JSON or MySQL plan file in the free online execution plan viewer, which draws the same kind of operator graph in the browser. It doesn't draw Oracle plans.
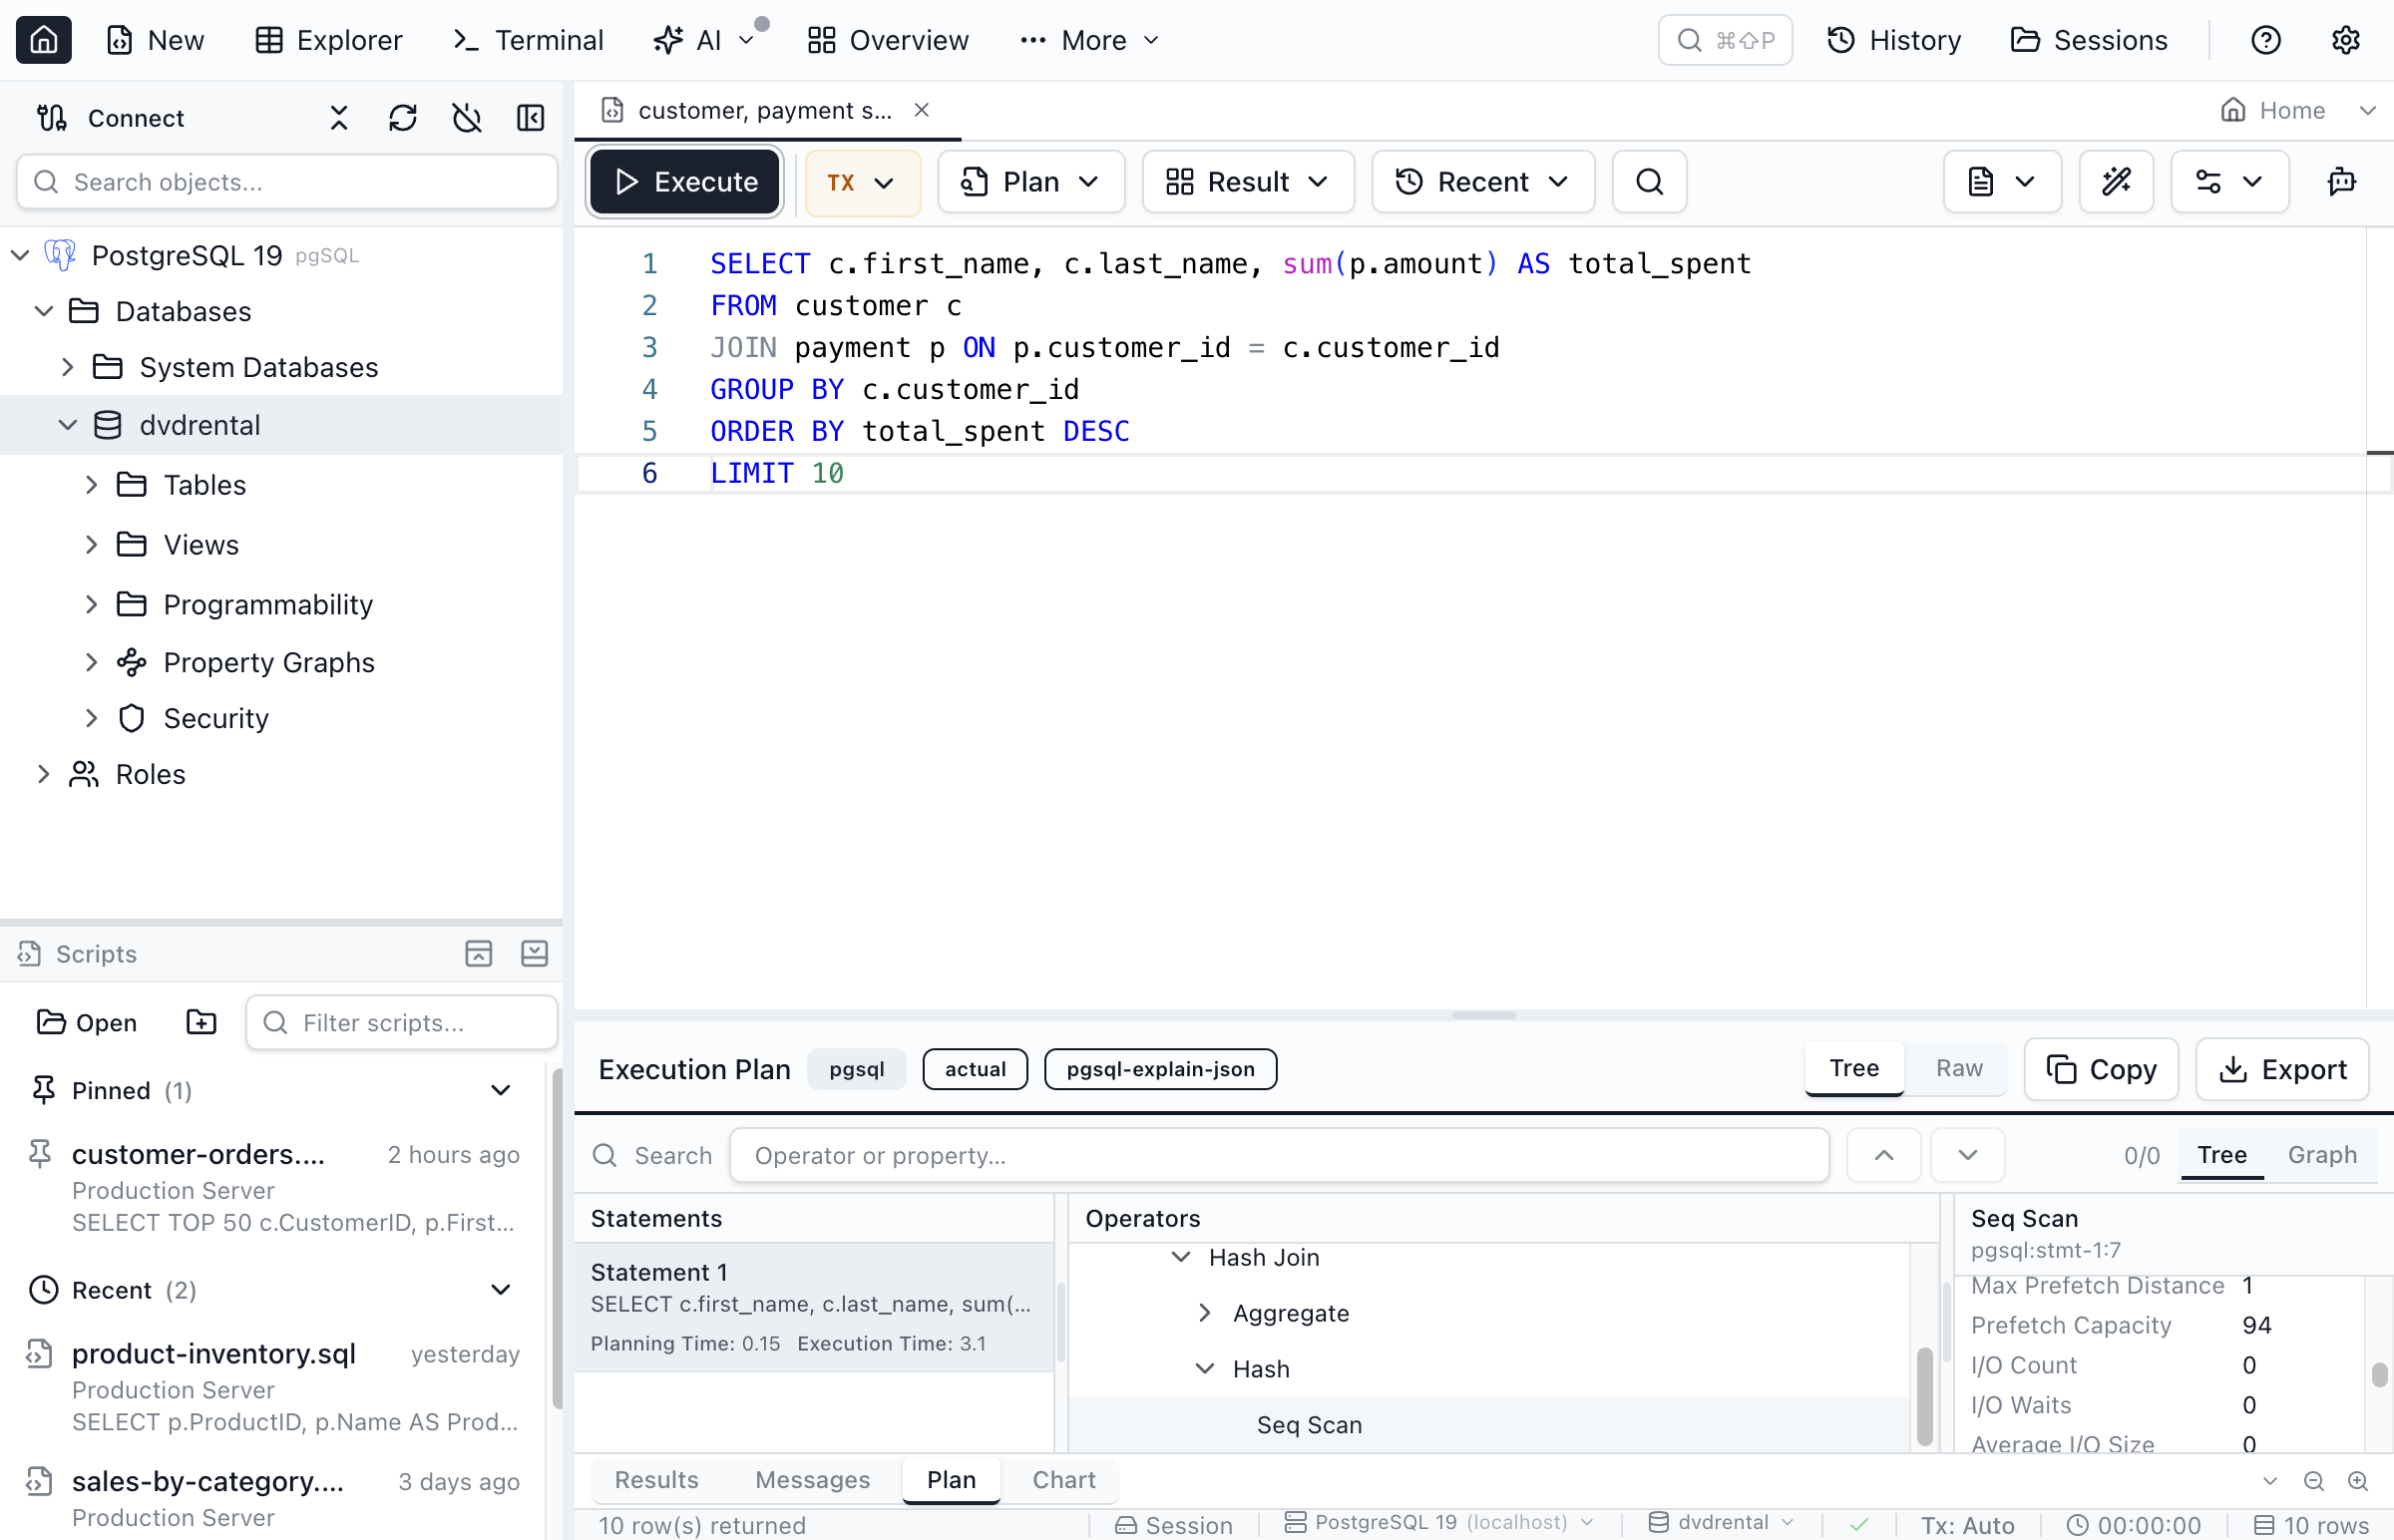
PostgreSQL: Planning/Execution Time Summary and IO Statistics (PostgreSQL 19, beta)
Every PostgreSQL actual plan now shows a compact summary strip under the statement title in the Statements list — Planning Time and Execution Time, taken directly from the values PostgreSQL itself returns in the EXPLAIN (ANALYZE, BUFFERS, FORMAT JSON) output. This works on any supported PostgreSQL version (these fields have existed since PostgreSQL 16); it's a plan-viewer fix, not a new PostgreSQL 19 capability.
On PostgreSQL 19+ specifically, actual-plan capture also adds the IO EXPLAIN option, which attaches extra IO counters to scan-type operator nodes: I/O Count, I/O Waits, Average I/O Size, Average Prefetch Distance, Max Prefetch Distance, Prefetch Capacity, and Average I/Os In Progress. Click a scan operator (for example a Seq Scan or Index Scan node) and open the Details panel to see them alongside the operator's other properties. On PostgreSQL 16–18, Jam SQL Studio detects the server version automatically and never requests the IO option, so the plan output is unchanged.
EXPLAIN IO option.Oracle Execution Plans
Jam SQL Studio captures estimated and actual Oracle execution plans. The plan is displayed in the same interactive diagram used for SQL Server, PostgreSQL and MySQL.
How Oracle Plans Work
For an estimated plan, Jam SQL Studio runs EXPLAIN PLAN FOR your statement and reads the plan rows from PLAN_TABLE. For an actual plan, it runs the statement with the GATHER_PLAN_STATISTICS hint and reads the rows from V$SQL_PLAN_STATISTICS_ALL. The rows are turned into the interactive tree and graph views. Actual plans are captured for SELECT and WITH statements only, because the statement is run.
Oracle-Specific Operators
TABLE ACCESS FULL
Full table scan. Consider adding indexes or partitioning.
INDEX RANGE SCAN
Efficient range lookup using a B-tree index.
HASH JOIN
Hash-based join for large datasets. Common in Oracle.
NESTED LOOPS
Row-by-row join. Efficient for small result sets with indexes.
Select an operator to see what the plan rows record for it: Cost, the estimated rows per start (CARDINALITY, labelled Cardinality in estimated plans and E-Rows in actual plans), bytes, the object, and the access and filter predicates. Actual plans add Starts and A-Rows (OUTPUT_ROWS), which are totals over all executions of the cursor, and the elapsed time, buffer gets and disk reads of the last execution, all from V$SQL_PLAN_STATISTICS_ALL. Compare A-Rows with E-Rows × Starts: a large gap usually means stale or missing statistics. The Note section that DBMS_XPLAN prints (dynamic sampling, SQL plan baselines, adaptive plans) is not part of these rows and is not shown.
MySQL Execution Plans
On MySQL and MariaDB, the estimated plan comes from EXPLAIN FORMAT=JSON and the actual plan from EXPLAIN ANALYZE (MySQL 8.0.18+, read-only SELECT/CTE statements only, because it executes the query). Both render in the same tree and graph views as the other engines, with the access type per table (ALL, ref, range, const, …) and the estimated rows examined per scan in the Details panel. Estimated plans keep their costs in cost_info objects, which the Details panel does not list; actual plans show the cost= figure of each EXPLAIN ANALYZE line that has one.
MySQL 8.3 introduced a second JSON layout for EXPLAIN FORMAT=JSON (explain_json_format_version = 2), and MySQL 9.5 and later make it the default. Jam SQL Studio asks the server for format version 1 for the duration of the plan capture and puts the session setting back afterwards, so estimated plans on MySQL 8.3, 9.x and newer render as the full operator tree — a join shows the nested loop and every table access, not a single collapsed node. Nothing changes on MySQL 8.0 or MariaDB, where the setting does not exist.
Performance Optimization Tips
What to Look For
- High-cost operators - Focus optimization on the most expensive operations
- Table scans on large tables - Consider adding appropriate indexes
- Key lookups - May indicate need for covering indexes
- Large row estimates vs actuals - Statistics may be outdated
- Parallelism - Queries using multiple cores for large operations
Common Optimizations
- Add indexes for columns used in WHERE, JOIN, and ORDER BY
- Update statistics if estimated row counts differ from actual
- Rewrite queries to avoid unnecessary operations
- Use covering indexes to eliminate key lookups
- Consider query hints for specific optimization needs
Frequently asked questions
How do I view an execution plan in Jam SQL Studio?
Open the Plan menu in the query editor toolbar and choose Explain plan for the estimated plan, or Execute with actual plan to run the query and capture the actual plan. The plan opens in the Plan tab of the results pane; actual plans add runtime statistics, while estimated plans show the optimizer's predictions without running the query.
What is the difference between estimated and actual execution plans?
Estimated plans show what the query optimizer predicts will happen without running the query. Actual plans show what really happened during execution, including row counts, memory grants, and execution times. Use actual plans to diagnose performance issues.
How do I identify slow operations in an execution plan?
On SQL Server and PostgreSQL plans, the percentage badge on each node is the operator's estimated subtree cost as a share of the statement, so the operator that carries the cost is the one whose percentage is much higher than its children's. Then look for scans of large tables where you expected an index seek, and select operators to compare estimated and actual rows in the details panel. On SQL Server plans a red !N badge counts the warnings recorded on that operator, such as a spill to tempdb or a missing join predicate; statement-level items such as missing-index suggestions and implicit-conversion warnings are not shown, and the lines between operators have a fixed width, so they do not show row volume.
Can I compare two execution plans?
Yes. Export the first plan, open the file with Open Execution Plan in the main toolbar's More menu, click Compare in the plan tab and pick the second plan from the Compare list, which offers every plan captured in an open query tab. The two plans are shown side by side under a summary of added and removed operators, matched operators whose type, cost or rows changed, and the root cost and rows before and after.
How do I save and share an execution plan?
Click Export in the plan toolbar to save the plan as it was captured: SQL Server plans as showplan XML (.sqlplan), PostgreSQL plans as EXPLAIN JSON (.explain.json), MySQL estimated plans as EXPLAIN FORMAT=JSON (.mysql.explain.json) and actual plans as EXPLAIN ANALYZE text (.mysql.explain-analyze.txt), and Oracle plans as Jam SQL Studio's JSON of the plan rows (.oracle.plan.json or .oracle.plan-actual.json). Every one of these files opens again in Jam SQL Studio with Open Execution Plan, and a .sqlplan file also opens in SSMS and other SQL Server tools. Copy puts the raw plan text on the clipboard instead.
Ready to Optimize Your Queries?
Download Jam SQL Studio and start analyzing execution plans today.