 Jam SQL Studio
 View SQL Server Geometry on a Map
A cross-platform viewer for SQL Server geometry and geography. Jam SQL Studio decodes the MSSQL spatial types and maps them in the results grid, a peek popover, a Query Editor Map tab, and a multi-layer Spatial Explorer — on Mac, Windows, and Linux, not just Windows.
Free for personal use • No account required • Mac, Windows, Linux
SQL Server stores spatial data as the geometry and geography CLR types, and SQL Server Management Studio shows a Spatial results tab when a query returns one. That's a genuinely useful viewer — but it only runs on Windows, shows one spatial column at a time, and has no basemap in its documented options (it offers grid lines and, for geography, four projections). The VS Code MSSQL extension, Microsoft's replacement for Azure Data Studio, lists no spatial viewer at all as of September 2026. If you work on a Mac, or you want the map alongside filters, layers, and export, you need another option.
Jam SQL Studio decodes SQL Server geometry and geography over the driver and renders them on a map on macOS, Windows, and Linux. Because it's a multi-engine SQL client, the same map surfaces also cover PostGIS, MySQL, Oracle, and SQLite — one viewer, five spatial databases.
SQL Server Geometry Viewer Comparison
How Jam SQL Studio compares to other ways of viewing SQL Server spatial data on a map.
| Question | Jam SQL Studio | SSMS 22 | VS Code + MSSQL | DBeaver |
|---|---|---|---|---|
| Map geometry / geography from query results | ✓ | ✓ Spatial results tab | — | GIS viewer; SQL Server needs Lite or higher |
| Runs on Mac and Linux | ✓ | ✗ Windows only | ✓ (no map) | ✓ |
| Basemap | ✓ OpenFreeMap tiles, opt-out; offline graticule | Grid lines; 4 projections for geography | — | ✓ Predefined and custom tile layers |
| Peek map for one cell in the grid | ✓ Both grids | Separate results tab | — | Viewer panel (PRO for SQL Server) |
| Curved geometry render + copy-stays-curved | ✓ | Display | — | — |
| Copy WKT / Copy GeoJSON from a cell | ✓ | Via query (.STAsText()) | Via query | Via query |
| Filter rows by map area, emitted as T-SQL | ✓ Bounding box, distance, drawn polygon | — | — | — |
| Several result sets as map layers | ✓ Spatial Explorer | One spatial column at a time | — | One result per viewer |
| Also maps PostGIS / MySQL / Oracle / SQLite | ✓ 5 engines | ✗ SQL Server only | ✗ SQL Server only | ✓ PostGIS, MySQL, SQLite free; Oracle in PRO |
| Price | Free for personal use; Pro $99/year | ✓ Free | ✓ Free | SQL Server spatial from $113/year (Lite) |
Not in the table: DataGrip's Geo viewer, which JetBrains documents for PostgreSQL tables and CSV/XLSX files (WKT, WKB or SRID 4326 geometry) rather than SQL Server's CLR types; and QGIS, a full GIS editor that can load SQL Server layers but is not a SQL client.
How to View SQL Server Geometry in Jam SQL Studio
From a geometry column to a map without booting into Windows.
Run a query that returns spatial data
Connect to your SQL Server (or Azure SQL) database and run a normal SELECT. Jam SQL Studio recognizes geometry and geography columns and shows a one-line summary in the grid instead of the raw CLR blob.
Peek a single feature
Click the peek button on any spatial cell for a fit-to-data mini map. Copy WKT or Copy GeoJSON straight from the popover, and use Load full geometry when a shape is too large to inline.
Plot every row on the Map tab
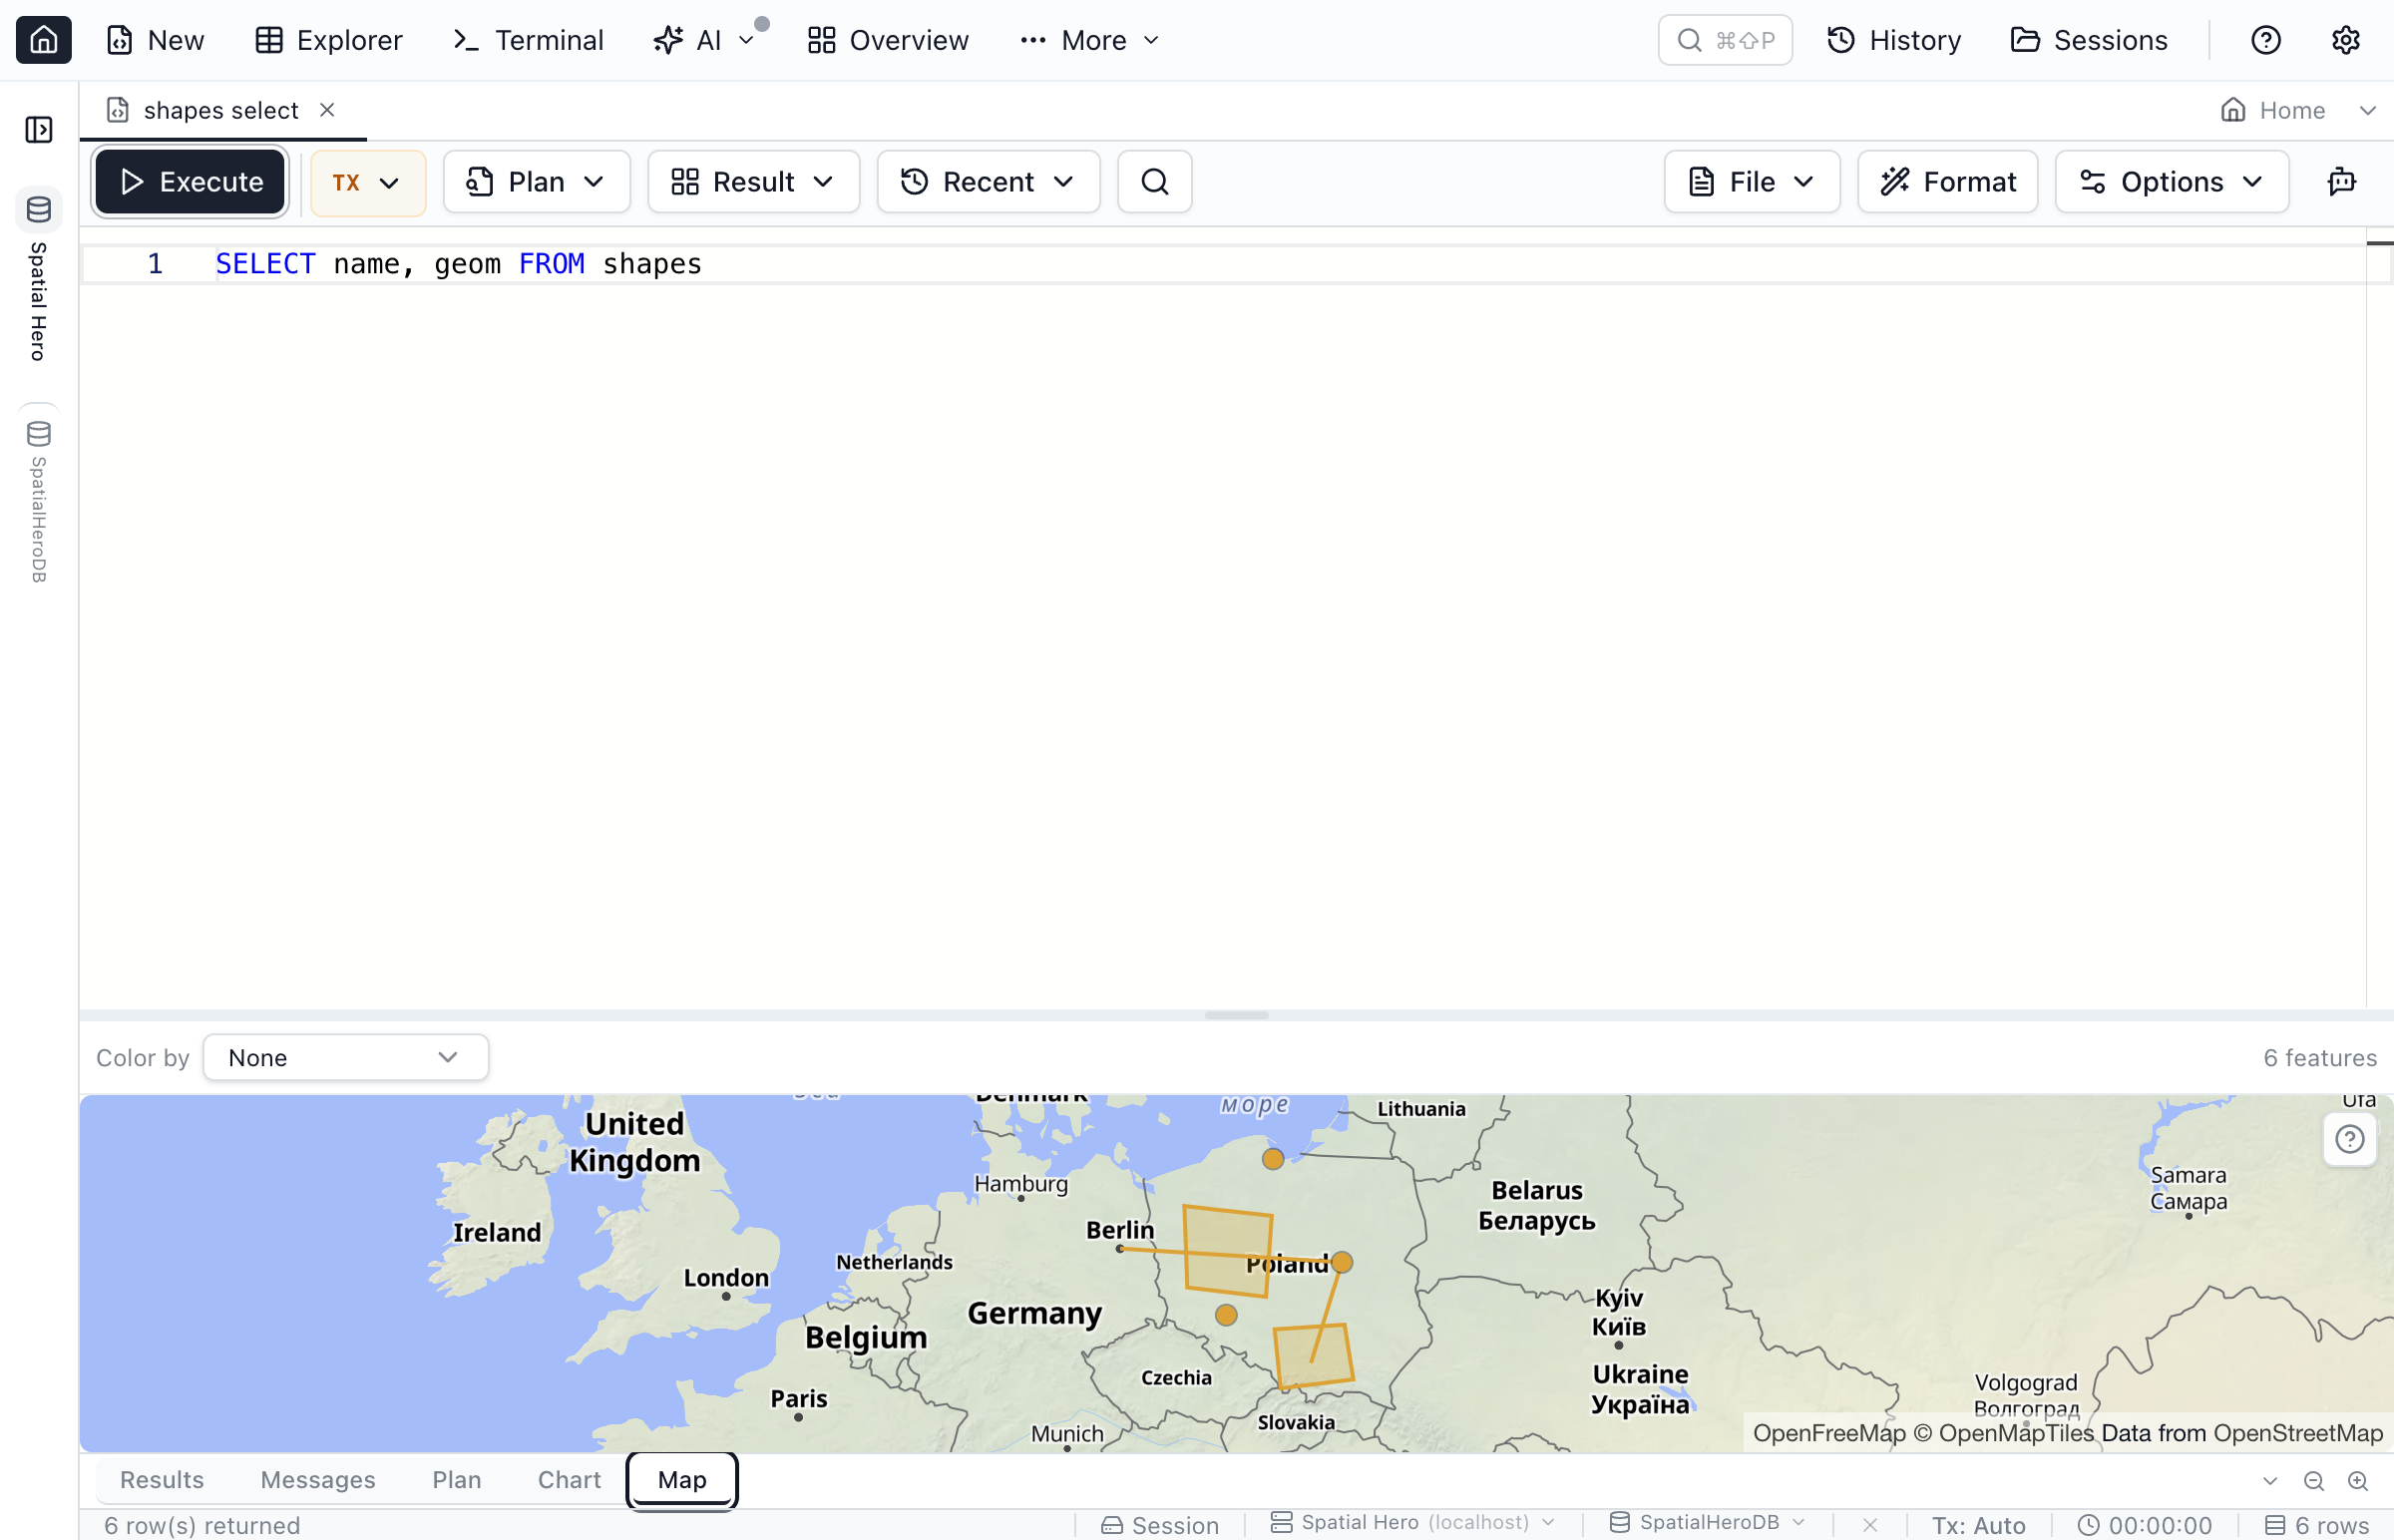
Switch the Query Editor results to the Map view to see all rows together, colored by a column with a live feature count. The map fetches an optional OpenFreeMap basemap (on by default, opt-out) and falls back to a planar graticule with no network when you turn it off or work offline.
Browse and filter by map area
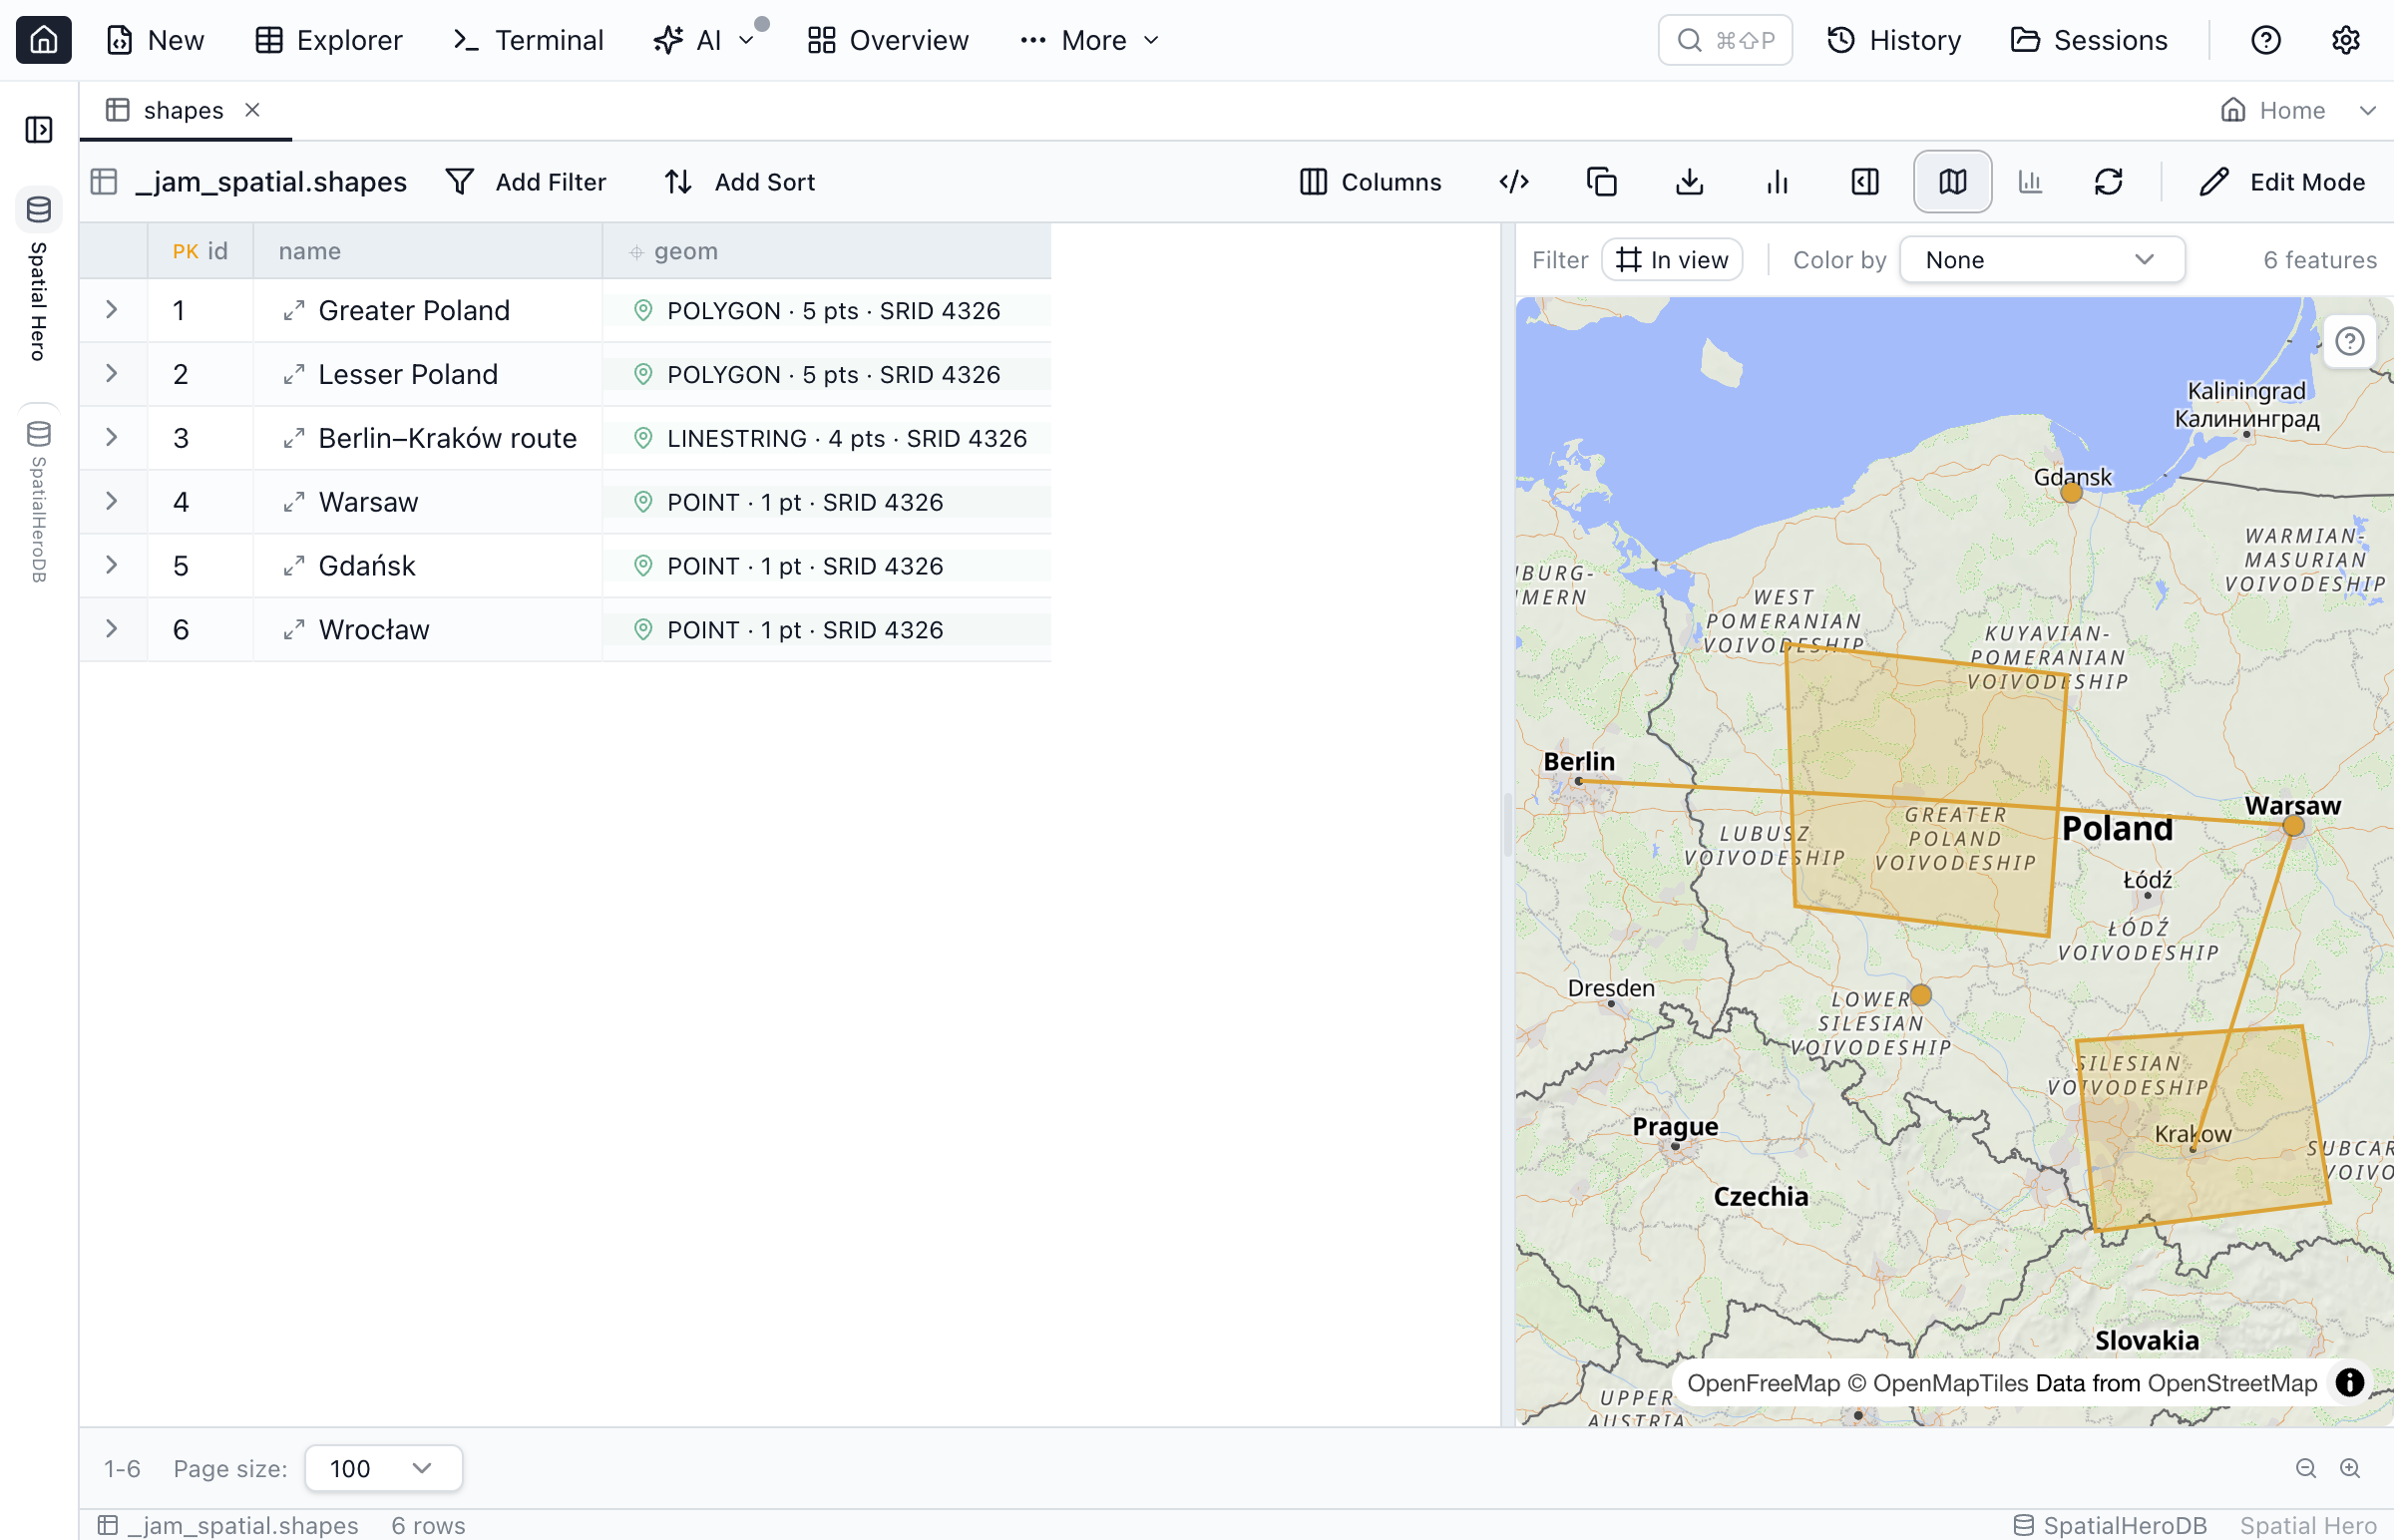
Open the table in the Table Explorer and use the map pane for two-way row-to-feature selection. Add bounding-box or distance filter chips and Jam SQL Studio writes the T-SQL predicate for you; In view limits rows to the visible extent, and Draw area lets you trace a polygon and keep only the rows inside it. See the spatial guide for which filters each column and SRID supports.
Overlay layers in Spatial Explorer
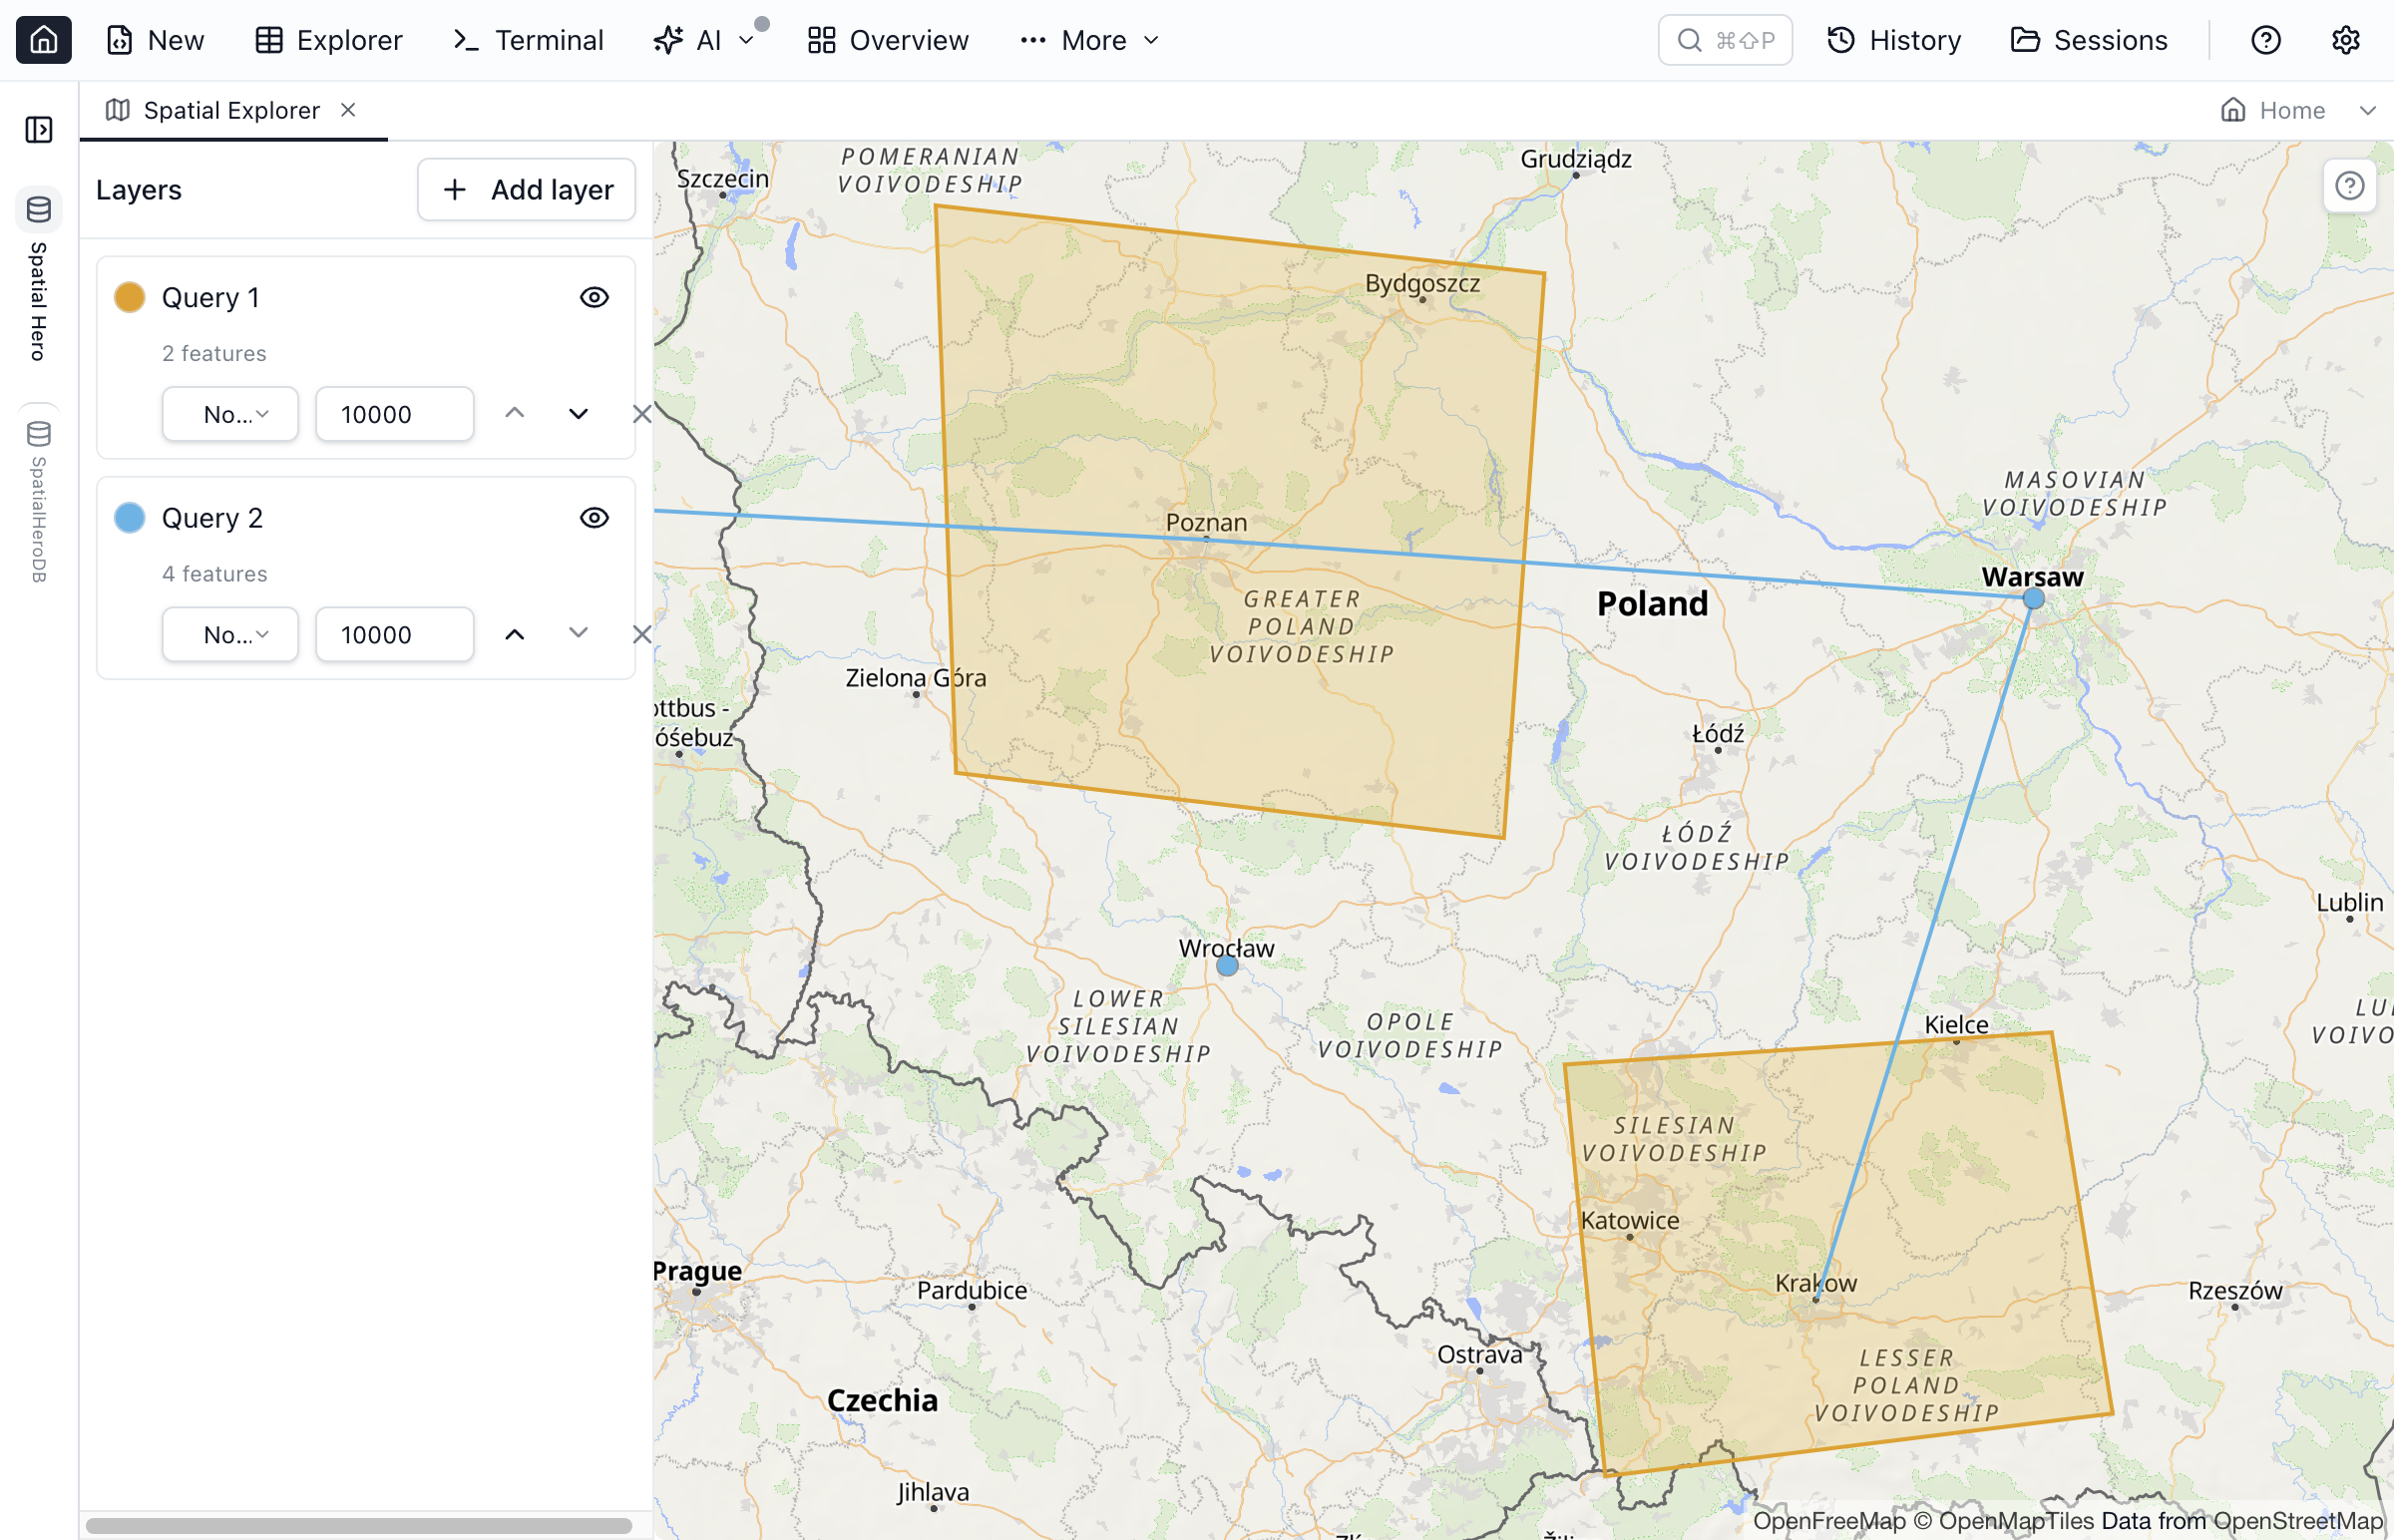
The Spatial Explorer workspace stacks multiple query or table layers, each with its own color, label column, feature cap, order, and visibility. Label columns render on the map, and a zoom-to-fit control brings every layer back into view. The full mechanics are in the spatial guide.
A SQL Server Spatial Viewer That Runs Everywhere
Visualize, inspect, and export geometry and geography without a Windows-only tool.
Grid Summary & Peek
Spatial cells show a type/point-count/SRID summary and a peek map in both the Query Editor and Table Explorer grids.
Map Results Tab
Plot a full result set on a basemap, color by a column, and read a live feature count from the Query Editor. The same map is available as a tile on SQL Dashboards (beta).
Spatial Filter Chips
Bounding-box, distance and drawn-area filters emit real T-SQL (STIntersects, STDistance), turning a map interaction into a reproducible query predicate.
Curves Stay Curved
CircularString and CompoundCurve arcs render on the map, while Copy WKT keeps the shape curved (a CircularString stays a CircularString, not the flattened display version).
Spatial Explorer Layers
Stack multiple queries and tables as colored layers with labels, caps, ordering, and visibility toggles.
Mac, Windows & Linux
Everything works on all three platforms — no remote desktop into Windows just to see a shape on a map.
Keyboard and Mouse Gestures
Step through features with J and K, hold M and drag to measure, hold Alt for coordinates, and paste WKT or drop GeoJSON onto the map to compare it with your rows. The (?) button in the map corner lists them.
Frequently Asked Questions
Common questions about viewing SQL Server geometry and geography on a map.
How do I view SQL Server geometry on a map?
Run a query that returns a SQL Server geometry or geography column. Each spatial cell shows a one-line summary and a peek button that opens a fit-to-data mini map. Switch the results to the Map tab to plot every row together, or use the Table Explorer map pane and the Spatial Explorer workspace for larger, multi-layer maps. It works on macOS, Windows, and Linux.
Can I view SQL Server spatial data on a Mac?
Yes. SQL Server Management Studio's Spatial results tab is Windows-only, but Jam SQL Studio is a cross-platform desktop app that decodes and maps SQL Server geometry and geography on macOS, Windows, and Linux.
Does it support both geometry and geography?
Yes. Jam SQL Studio decodes both SQL Server spatial CLR types — geometry and geography — through the driver and renders them on the map, reading the SRID to project coordinates.
Does it handle curved geometry like CircularString or CompoundCurve?
Yes. Curved SQL Server geometry (CircularString, CompoundCurve, CurvePolygon) is linearized client-side so the arcs render on the map, while Copy WKT keeps the shape curved (a CircularString stays a CircularString, not the flattened display version) rather than a densified approximation.
Can I copy the geometry as WKT or GeoJSON?
Yes. From the peek popover you can Copy WKT or Copy GeoJSON for any SQL Server geometry or geography value; grid copy (Ctrl+C) and CSV / XLSX export emit WKT. Either way you can paste it into another tool or a support ticket. The free WKT viewer is handy for a quick browser check.
Can I filter SQL Server spatial data by map bounds?
Yes. The Table Explorer map pane adds bounding-box and distance filter chips that emit T-SQL, an In view button that limits rows to the visible map extent, and a Draw area tool: trace a polygon on the map and the grid keeps the rows whose geometry falls inside it, filtered with STIntersects.
Can I edit geometry on the map?
No. You can draw a polygon on the Table Explorer map to filter rows, but Jam SQL Studio never edits stored geometry or writes shapes back to the database. It is a viewer, filter and export path (Copy WKT, Copy GeoJSON), not a GIS authoring editor such as QGIS.
What other databases' spatial data does it map?
In addition to SQL Server, Jam SQL Studio decodes and maps spatial data from PostgreSQL/PostGIS, MySQL, Oracle (SDO_GEOMETRY), and SQLite (SpatiaLite and GeoPackage), so one tool covers spatial across all five relational engines.
Map Your SQL Server Spatial Data Anywhere
Download Jam SQL Studio free and view geometry and geography on Mac, Windows, or Linux.
Explore More
See how Jam SQL Studio handles spatial data and SQL Server.
Further reading: Spatial & PostGIS guide · Free WKT viewer · Query Editor · Table Explorer