
Last updated: 2026-09-06
SQL Dashboards
Build multi-tile dashboards over live SQL without leaving your database IDE. Each tile runs its own query — against any saved connection, any engine — and renders as a chart, stat, table, pivot, or note, with auto-refresh, parameters, cross-filtering, and alerts built in.
What is a SQL dashboard in Jam SQL Studio?
A dashboard is a grid of tiles, where every tile is backed by a SQL (or KQL) query you can always see and edit. There is no separate BI server, no data model to publish, and no per-viewer licensing — dashboards live inside Jam SQL Studio next to your Query Editor and Table Explorer, and they query your databases directly over the connections you already saved. The connection is chosen per tile, so one dashboard can mix SQL Server, PostgreSQL, MySQL/MariaDB, Oracle, SQLite, and Kusto/Azure Data Explorer tiles on the same screen.
Dashboards is off by default. Turn it on in Settings → Beta Features; that adds the toolbar button, the Object Explorer node, and the Pin to dashboard actions described below.
Open dashboards from the Dashboards button in the main toolbar, or from the Dashboards node in the Object Explorer. On a fresh install, starter dashboards offer a one-click, engine-appropriate set of tiles so the first dashboard isn't a blank page.
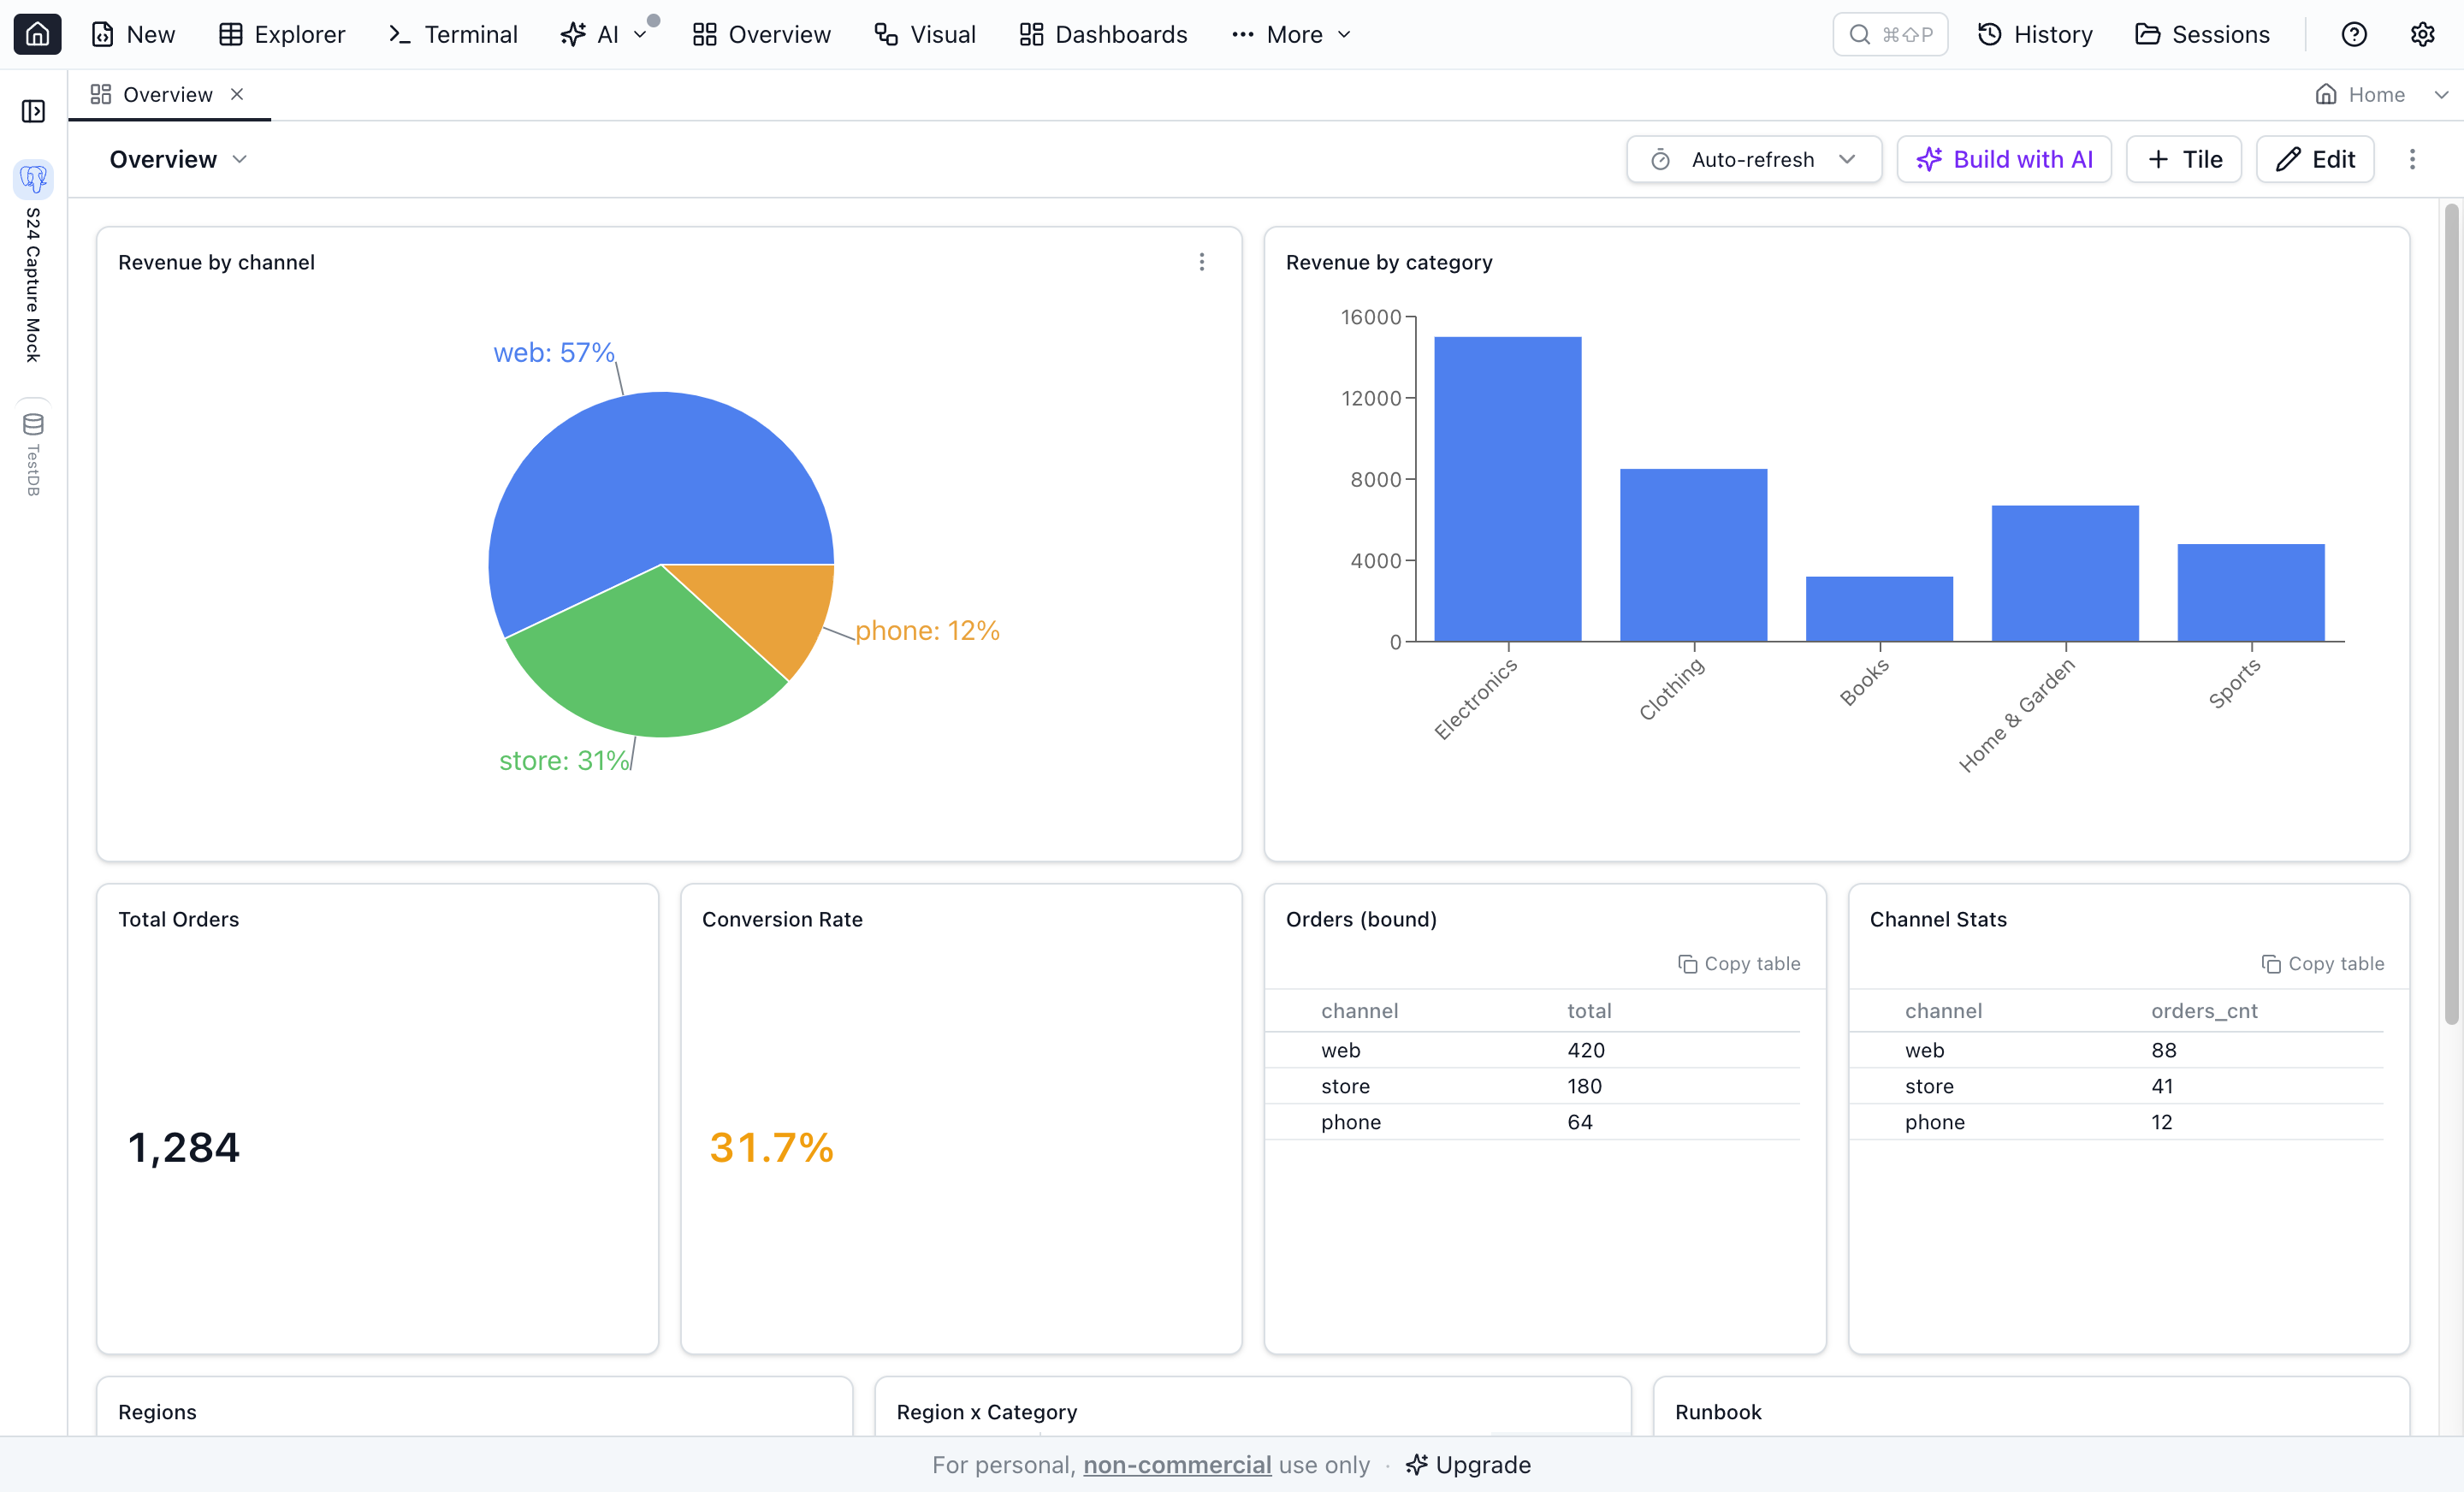
Tile types
| Tile | Shows | Key options |
|---|---|---|
| Chart | Bar, line, pie, area, or scatter chart of the query result | Same chart builder as the Charts tab, plus dashed reference lines (target values / goal bands with warning or critical coloring) |
| Stat | One big number from the result | Value column, format (number, percent, currency, duration), compare against a previous-period column or a fixed target, optional sparkline, warning/critical thresholds, alert rules |
| Table | The raw rows | Row limit, column subset, compact/comfortable density, conditional formatting per column |
| Pivot | Rows × columns cross-tab | Row column, column column, value column, aggregation (sum, avg, min, max, count) |
| Map | The query's geometry/geography rows plotted on the same map surface as the Query Editor's Map view | Geometry column (auto-detected by default) and an optional color-by column; the map suggests itself automatically when the preview contains a spatial column |
| Note | Markdown text | No query — use for headings, runbooks, and links between sections |
Tiles live on a 12-column grid: drag to move, drag edges to resize, or use the keyboard — arrow keys move a focused tile and Shift+arrows resize it, with the grid compacting upward automatically. Edit tints the canvas with a dot grid so you can always tell you're rearranging rather than reading, and removing a tile raises an Undo toast that puts it back exactly where it was.
Adding tiles — four sources
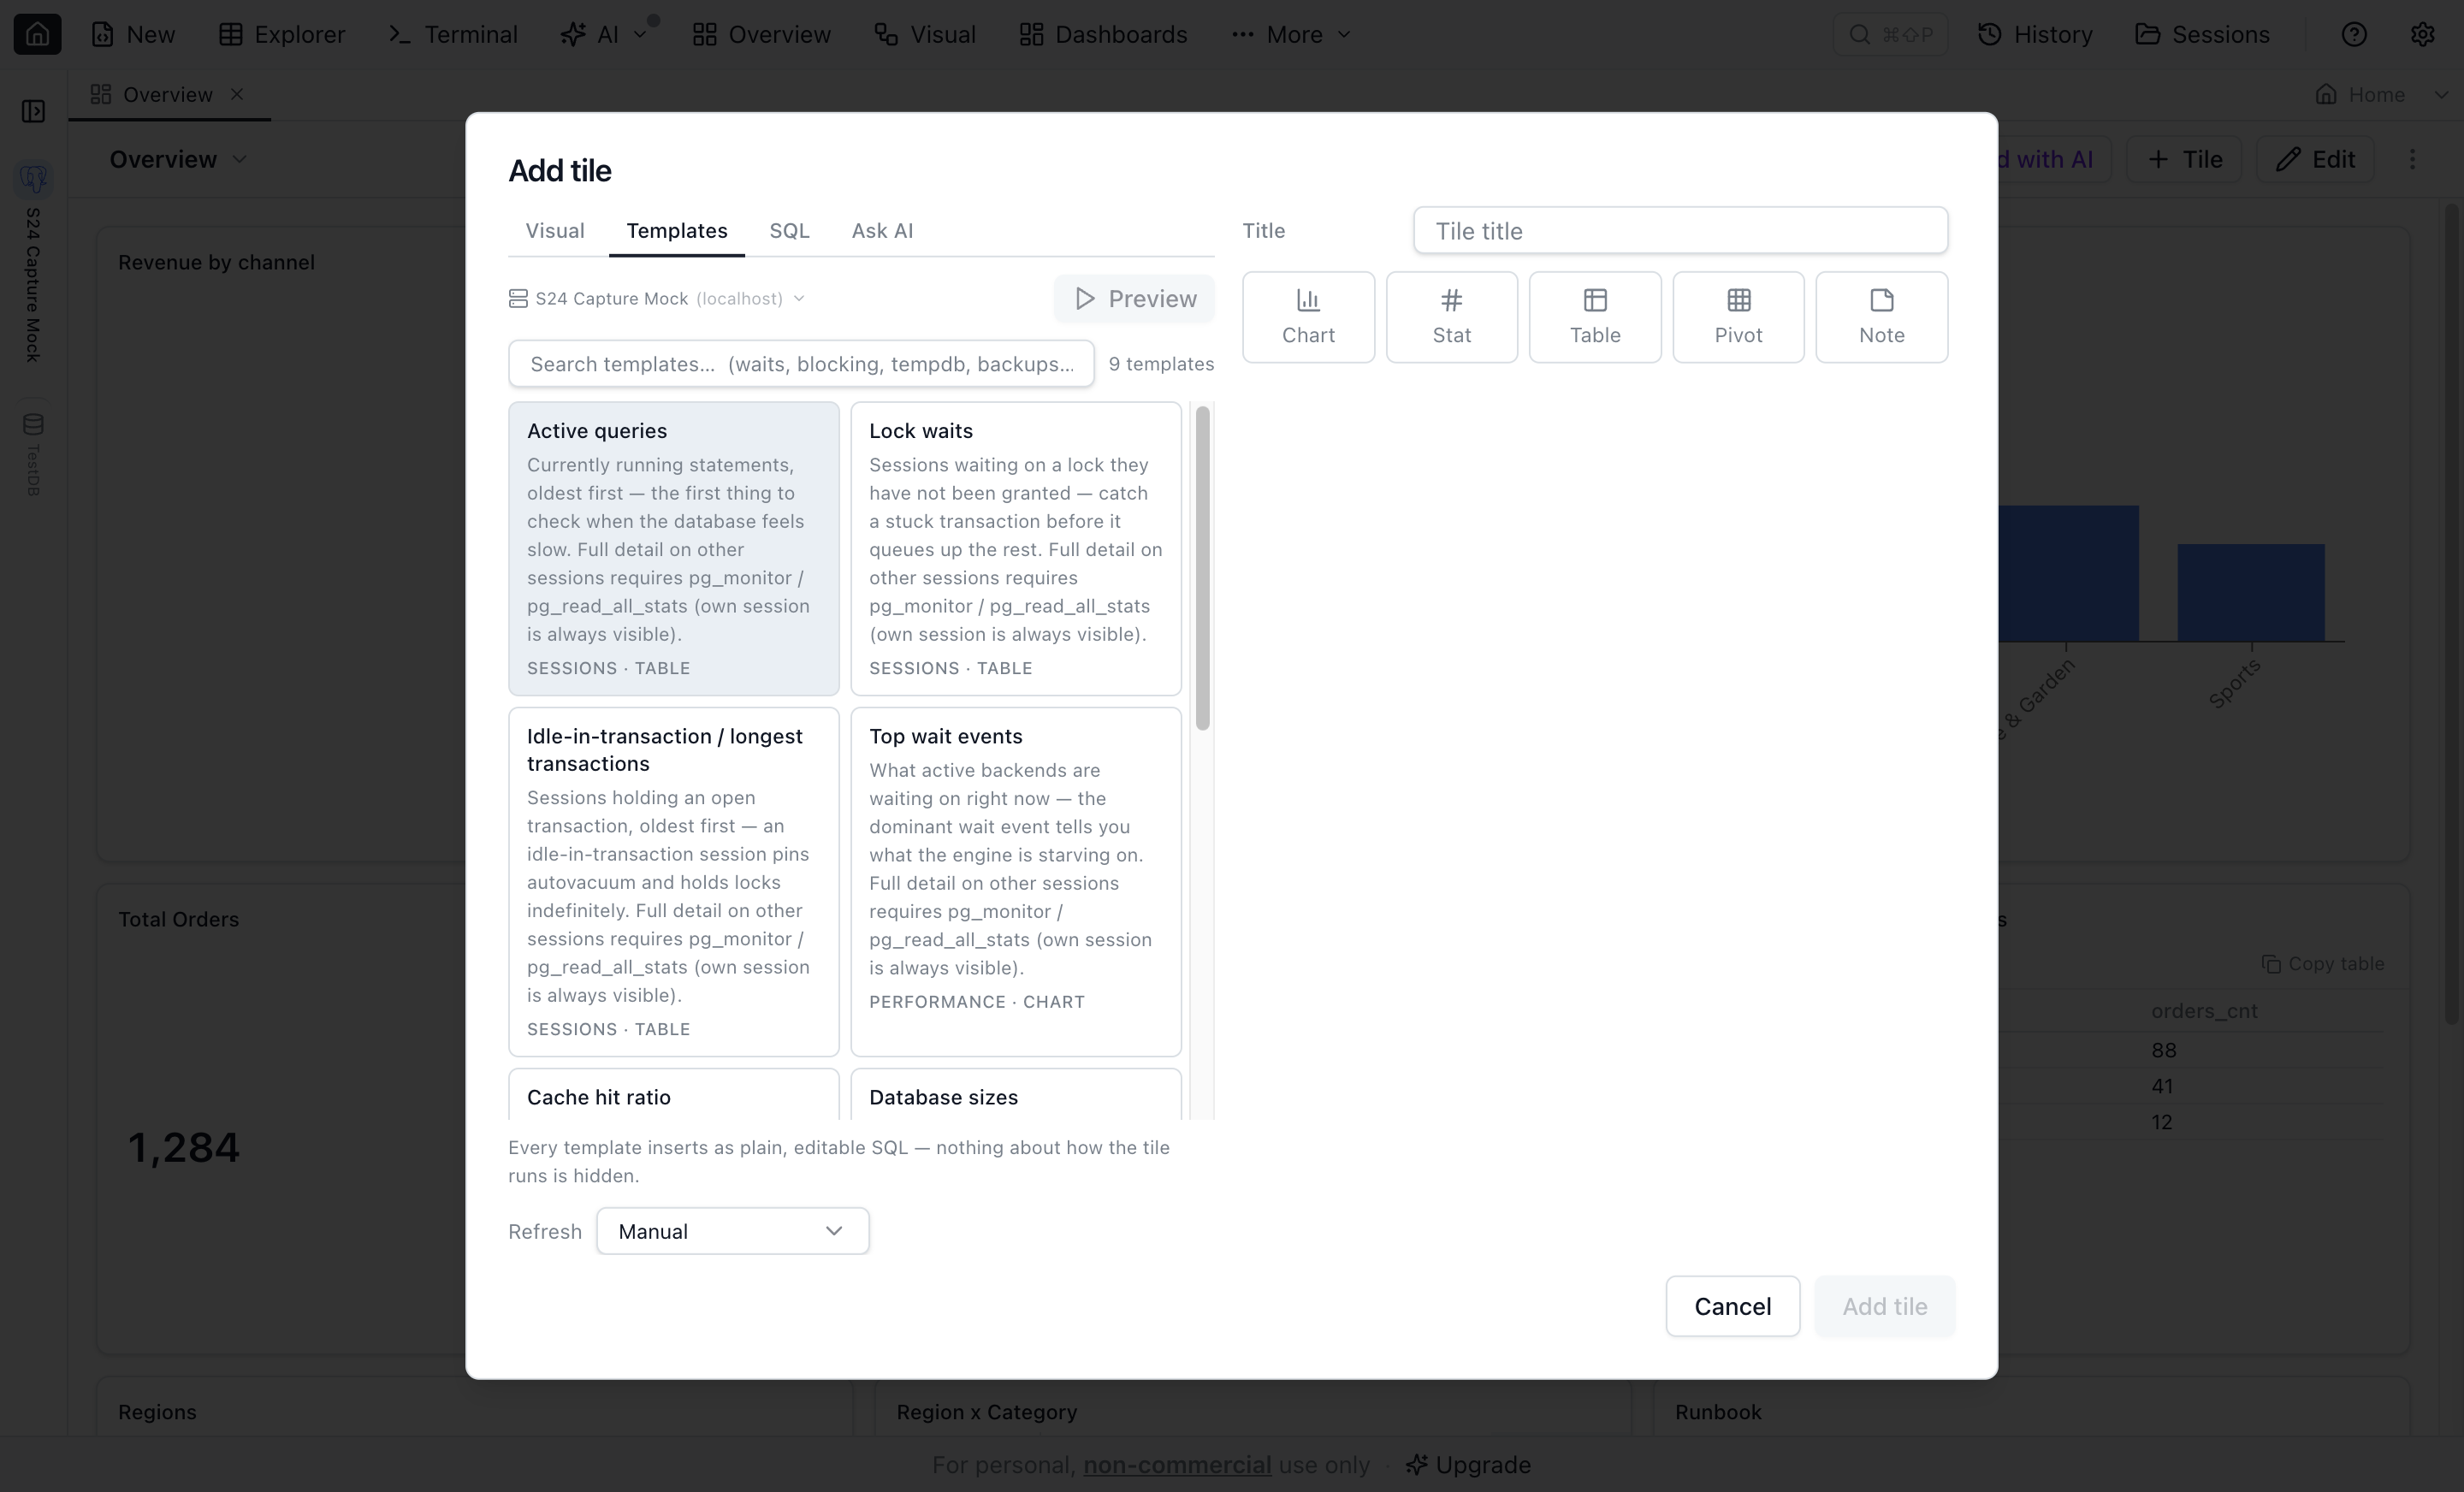
The Add tile dialog offers four ways to produce the tile's query, all ending in the same live, read-only preview before anything is saved. Every source shares the same header row: pick the connection and the database the query runs against — the database defaults to the connection's own, or to its first listed database when the connection was saved without a default, and you can switch it any time. Below the configuration a tile preview renders the tile exactly as it will appear on the dashboard — chart, stat, table, and pivot update live as you change the type or its settings, using the rows from the last preview run.
- SQL — write or paste a query, run the preview, and pick the result set if the script returns several. The dialog auto-selects the tile type that best fits the result's shape (a sparkles badge marks the suggested card, pre-configured with matching axes or value columns) — pick a different card any time to override.
- Templates — a built-in catalog of DBA queries per engine (see below). Selecting a template first shows a detail view — full description, required permissions, and the SQL itself — and Use template then drops that SQL into the editor fully editable — nothing is hidden behind the tile.
- Visual — build the query in the Visual Query Editor without typing SQL.
- AI — describe the tile in plain English; the AI drafts the SQL, you preview and accept. A whole-dashboard Build with AI panel proposes several tiles at once, each individually previewable and rejectable — nothing runs or is added before you act.
You can also pin an existing result onto a dashboard from outside: the pin button on the Query Editor results toolbar (or a result cell's right-click menu), the Table Explorer toolbar, and the chart toolbar all open a confirm sheet that shows exactly what query the tile will carry before it lands.
Template catalog
70 DBA templates ship across the six engines, sourced from the same queries that power the Session Browser, Performance Dashboard, and DBA toolkit — grouped into sessions, performance, indexes, storage, backup, and jobs categories:
| Engine | Templates | Examples |
|---|---|---|
| SQL Server | 14 | Longest running queries, blocking chains, top waits, index fragmentation, unused indexes, transaction log usage |
| PostgreSQL | 14 | Active queries, lock waits, connection saturation, dead tuple pressure, sequential scan hotspots, invalid indexes |
| Oracle | 13 | Active sessions, blocking locks, buffer cache hit ratio, session saturation, top segments by size, RMAN backup status |
| MySQL / MariaDB | 12 | Active queries, InnoDB lock waits, connection saturation, largest tables, rows read without an index |
| Kusto / ADX | 10 | Running queries, ingestion failures, cluster diagnostics, tables by extent count, recent ingestion by table |
| SQLite | 7 | Database file size, tables without an index, unindexed foreign keys, index overhead, integrity check |
Templates are honest about compatibility: one that needs a server version or capability your connection hasn't proven is hidden, not shown greyed out, and templates that need a specific grant (for example VIEW SERVER STATE) carry a lock glyph on their card and spell the requirement out in the detail view.
Refresh and the execution policy
- Each tile refreshes manually or on an interval you choose; the toolbar also has a refresh-all. The toolbar's auto-refresh control doubles as a readout — it shows the dashboard's current cadence (
Auto-refresh · 30s, ormixedwhen tiles differ) with a hairline bar counting down to the next cycle, and picking a cadence from it sets every query tile at once. - Refreshes use only the current parameter and cross-filter values for each tile; earlier combinations are discarded.
- Tile queries run under a read-only policy — a statement classified as a write is blocked from scheduled refresh, from the Add Tile preview, and from any run with a cross-filter applied. Scheduled refresh has one exception: you can explicitly trust one exact tile query, and that trust is revoked automatically the moment the SQL changes. Running a tile yourself still executes writes, with the usual confirmation for destructive statements.
- On MySQL, the check also accounts for
NO_BACKSLASH_ESCAPESandANSI_QUOTES, so changing quote modes cannot hide a recognized lock or write call from a preview or untrusted refresh. Your session's SQL mode stays unchanged. - Stopping a tile while Jam SQL is still loading its saved settings cancels the pending run before it reaches the database. Once execution has started, Stop sends cancellation to the database engine.
- The read-only check reads the statement that actually runs, after your parameter and filter values are composed into it, and it looks past the statement's first keyword. It refuses a write nested in a CTE,
SELECT … INTO OUTFILE, a lockingFOR UPDATE, a procedure call, and the sequence-advancing spellings it knows by name (nextval(),seq.NEXTVAL,NEXT VALUE FOR seq). It also splits the text with each engine's own literal rules — PostgreSQL dollar quotes andE'…', Oracleq'[…]', MySQL backslash escapes and executable comments, SQL Server and SQLite bracketed identifiers, and a SQL ServerGOline as a batch separator — and when the connection's engine is not known it takes the split under every one of them and refuses if any of them finds a second statement. That covers the spellings listed here; a literal form none of those lexers models could still read as a single statement. Quoting a name does not hide it either:"setval",[xp_cmdshell]and PostgreSQL's escapedU&"set\0076al"are read as the names the server resolves them to. What it checks is a list of known write forms, not a proof that the query is harmless: a write it has no name for, and anything inside a function, view, or trigger the query calls, stay invisible to it — if a query must be incapable of side effects, connect the dashboard with a read-only database login. - Hidden dashboards pause their schedules and catch up once visible; a refresh that would overlap a still-running query skips the cycle instead of piling up; a tile that takes far longer than its usual duration gets flagged.
- An issue-only health rail lists failing or stale tiles as clickable chips — click one to spotlight the tiles it counts, or use Refresh stale to re-run all of them at once. The rail stays out of the way when everything is green.
- Hovering a tile reveals its freshness — "Updated 2m ago" plus how long the last run took. A tile that can't refresh keeps showing its last known values, dimmed, under a visible "Stale" line, instead of hiding them behind an explanation; and error or blocked tiles carry inline Retry, Run now, and Configure buttons so recovery is one click, not a menu hunt.
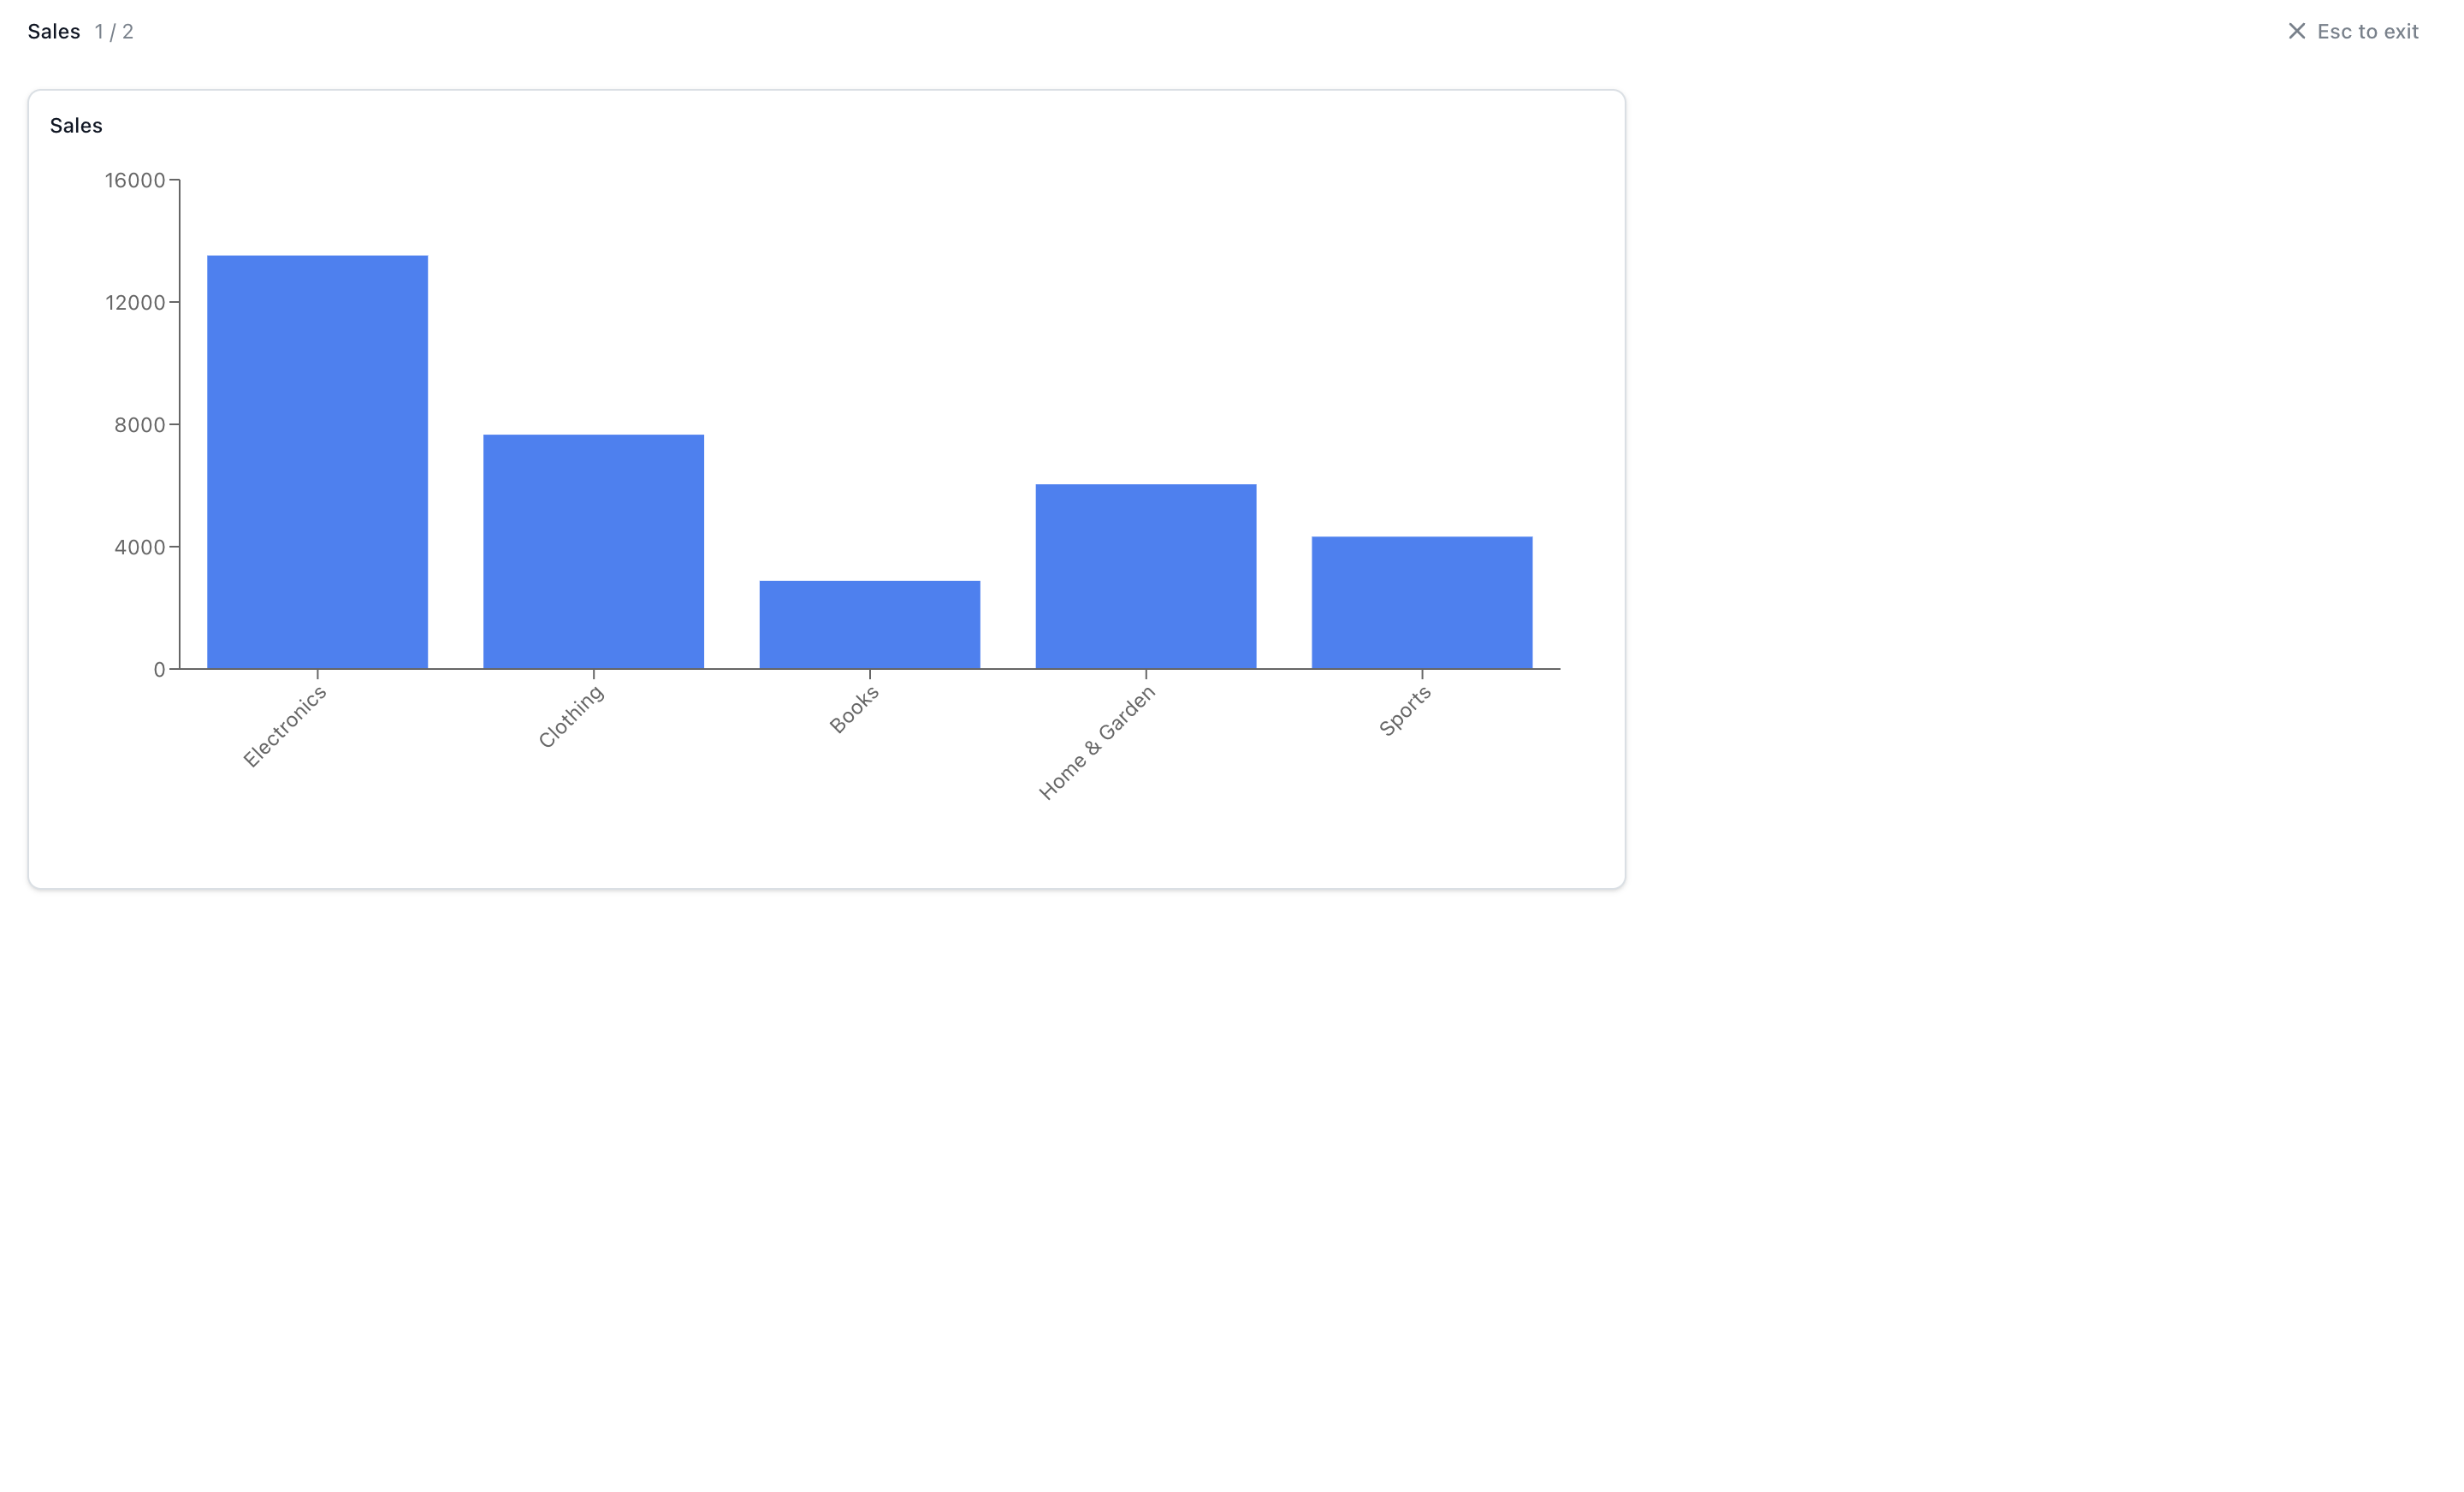
- Any tile can be expanded to a large overlay (tile menu → Expand tile, or double-click its title) — tables show all fetched rows there, charts get room to breathe, and nothing about the dashboard layout changes.
Parameters
MySQL parameter values bind independently of question marks inside SQL strings or comments. Preview and untrusted scheduled execution reject recognized writes inside CTEs, side-effecting built-in calls, and executable comments.
Dashboards accept typed parameters that tiles reference in their SQL: a time range (7/28/90 days or a custom from–to), a static list, a query-driven list (label and value columns, optionally cascading off other parameters), and free text. List parameters support multi-select and an "All" option. Values persist per dashboard and never travel in exported definitions.
Cross-filtering and drill-through
Click a chart mark (a bar, a point, a pie slice) or a table row and the dashboard applies that value as a filter to every tile that opted in. Wiring is by example: you map each tile's column or expression to a shared dashboard field once, and clicks do the rest. From a filtered tile you can drill through to a full Query Editor tab carrying the tile's query and the active filters.
Alerts (stat tiles)
A stat tile can carry an alert rule — an operator and threshold that fires an OS notification when crossed, with a cooldown between notifications and automatic re-arm when the value recovers. Alerts can optionally keep refreshing in the background while the dashboard is hidden, on a separate budget so background tiles can't starve the visible ones. Thresholds (warning / critical coloring) work without alerting, too.
Present mode and playlists
Present takes a dashboard full-screen for a wall monitor. The dashboard is scaled to fit the display, so a few tiles fill the screen at readable size instead of sitting small in the corner — toggle Fit to screen off for actual desktop size, and dashboards taller than the screen keep their normal scale and scroll. A playlist rotates through several dashboards at a fixed cadence, pre-warming the next dashboard's queries so rotation never shows a wall of spinners; the 1 / 2 indicator carries a countdown ring showing time to the next switch.
Dashboards in the Object Explorer
Once at least one dashboard exists, a Dashboards node appears at the top of the Object Explorer. Double-click a dashboard to open it. The right-click menu offers:
- Open — open the dashboard tab.
- Present — jump straight to full-screen present mode.
- Settings… — opens dashboard settings (name, description, parameters, playlist). A dashboard with a description shows an ⓘ next to its name in the toolbar that reveals it on hover.
- Duplicate — disabled with an explanatory tooltip when the free-tier cap is reached.
- Export definition… — save the dashboard as a JSON file.
- Delete — with a confirmation dialog.
Sharing and export
- Definition export/import (JSON) — the file carries queries, layout, and parameters, never credentials or parameter values. Importing on another machine offers a connection remap step listing engine-compatible saved connections for each tile.
- PNG / PDF — capture the rendered dashboard for a report or a ticket.
- Interactive HTML snapshot (Pro) — a single self-contained file with the data baked in: tables sort locally, nothing phones home (zero network requests), safe to email.
AI agents and MCP
AI agents connected over MCP get five dashboard tools: dashboard_list, dashboard_create, dashboard_add_tile (full tile JSON or a template id), dashboard_update_tile, and dashboard_refresh (per-tile success/error report). Changes made by an agent appear live in the open app.
Free vs Pro
The free Personal tier includes 2 dashboards with every feature above except the HTML snapshot. Pro removes the dashboard cap and adds the interactive HTML snapshot export.
FAQ
How do I create a SQL dashboard in Jam SQL Studio?
Click the Dashboards button in the main toolbar, name your dashboard, and add tiles. Each tile runs its own SQL query against any saved connection and renders as a chart, stat, table, pivot, or markdown note on a 12-column grid. You can also pin an existing result straight from the Query Editor, Table Explorer, or a chart.
Which databases can dashboard tiles query?
All engines Jam SQL Studio supports: SQL Server, PostgreSQL, MySQL/MariaDB, Oracle, SQLite, and Kusto/Azure Data Explorer (KQL). Every tile picks its own connection, so one dashboard can mix tiles from different servers and engines side by side.
Can dashboard tiles auto-refresh?
Yes. Each tile is either manual or on an interval you choose. Refreshes run read-only, pause while the dashboard is hidden and catch up when it becomes visible again, skip a cycle instead of overlapping when a query is still running, and warn when a tile takes far longer than its usual duration.
Can one dashboard combine data from different connections?
Yes. The connection is chosen per tile, not per dashboard — a production PostgreSQL chart can sit next to a SQL Server stat and a Kusto table on the same grid.
How many dashboards can I create for free?
The free Personal tier includes 2 dashboards with every tile type, templates, parameters, cross-filtering, alerts, present mode, and PNG/PDF export. Pro removes the dashboard cap and adds the interactive HTML snapshot export.
Can I share a dashboard with a teammate?
Yes, two ways. Export the dashboard definition as JSON — importing it on another machine offers a connection remap step so tiles bind to the teammate's own engine-compatible connections; no credentials ever travel in the file. Or export an interactive HTML snapshot (Pro): a single self-contained file with the current data, sortable tables, and zero network calls.
Can AI create dashboard tiles?
Yes. The Add Tile dialog has an AI source that drafts a query from a plain-English request, and the Build with AI panel proposes several tiles for a whole dashboard at once — each proposal is previewed read-only and nothing is added until you accept it. External AI agents can also manage dashboards through the dashboard_* MCP tools.
Related
- Charts — the chart builder dashboards reuse
- Query Editor — pin results to a dashboard
- Table Explorer — pin table views to a dashboard
- AI Integrations & MCP — dashboard tools for AI agents
- Keyboard Shortcuts — grid move/resize keys