Last updated: 2026-03-18
PL/SQL Debugger
Step through PL/SQL stored procedures, functions, package bodies, triggers, and anonymous blocks. Set breakpoints, inspect variables, navigate the call stack, and evaluate watch expressions — all from a modern cross-platform IDE.
Prerequisites
Before debugging, ensure your Oracle user has the required privileges and the program unit is compiled with debug information.
Required Privileges
Your Oracle user needs two privileges to use the debugger:
- DEBUG CONNECT SESSION — allows establishing a debug session
- DEBUG ANY PROCEDURE — allows debugging any PL/SQL program unit
Ask your DBA to run:
GRANT DEBUG CONNECT SESSION TO your_user;
GRANT DEBUG ANY PROCEDURE TO your_user;
GRANT EXECUTE ON SYS.DBMS_DEBUG TO your_user;Jam SQL Studio automatically checks for these privileges when you start a debug session. If any are missing, the error message includes the exact GRANT statements to run.
Compile for Debug
Stored program units (procedures, functions, packages, triggers) must be compiled with debug information before breakpoints will work. Anonymous blocks do not need this step.
To compile with debug:
- Package Browser — click the Compile Debug button (bug icon) in the toolbar. A green "debug" badge appears when the package is compiled with debug info.
- Object Explorer — right-click any procedure, function, package, or trigger and select Compile for Debug.
Behind the scenes this runs ALTER ... COMPILE DEBUG. You can verify the status in ALL_PLSQL_OBJECT_SETTINGS where PLSQL_DEBUG = 'TRUE'.
Opening the Debugger
There are three ways to open the PL/SQL Debugger:
From the Object Explorer
- Expand your Oracle connection in the sidebar
- Right-click a procedure, function, or package
- Select Debug from the context menu
- The debugger tab opens with the program source loaded
From the Package Browser
- Open any package in the Package Browser
- Click the Debug button (play icon) in the toolbar
- The debugger tab opens with the package body source
From the Query Editor (Anonymous Blocks)
- Write a PL/SQL block (
BEGIN...END;orDECLARE...BEGIN...END;) in the Query Editor - Click the Debug button (bug icon) in the query toolbar — it appears automatically when Oracle is connected and the editor content is a PL/SQL block
- The debugger tab opens with your code ready to debug
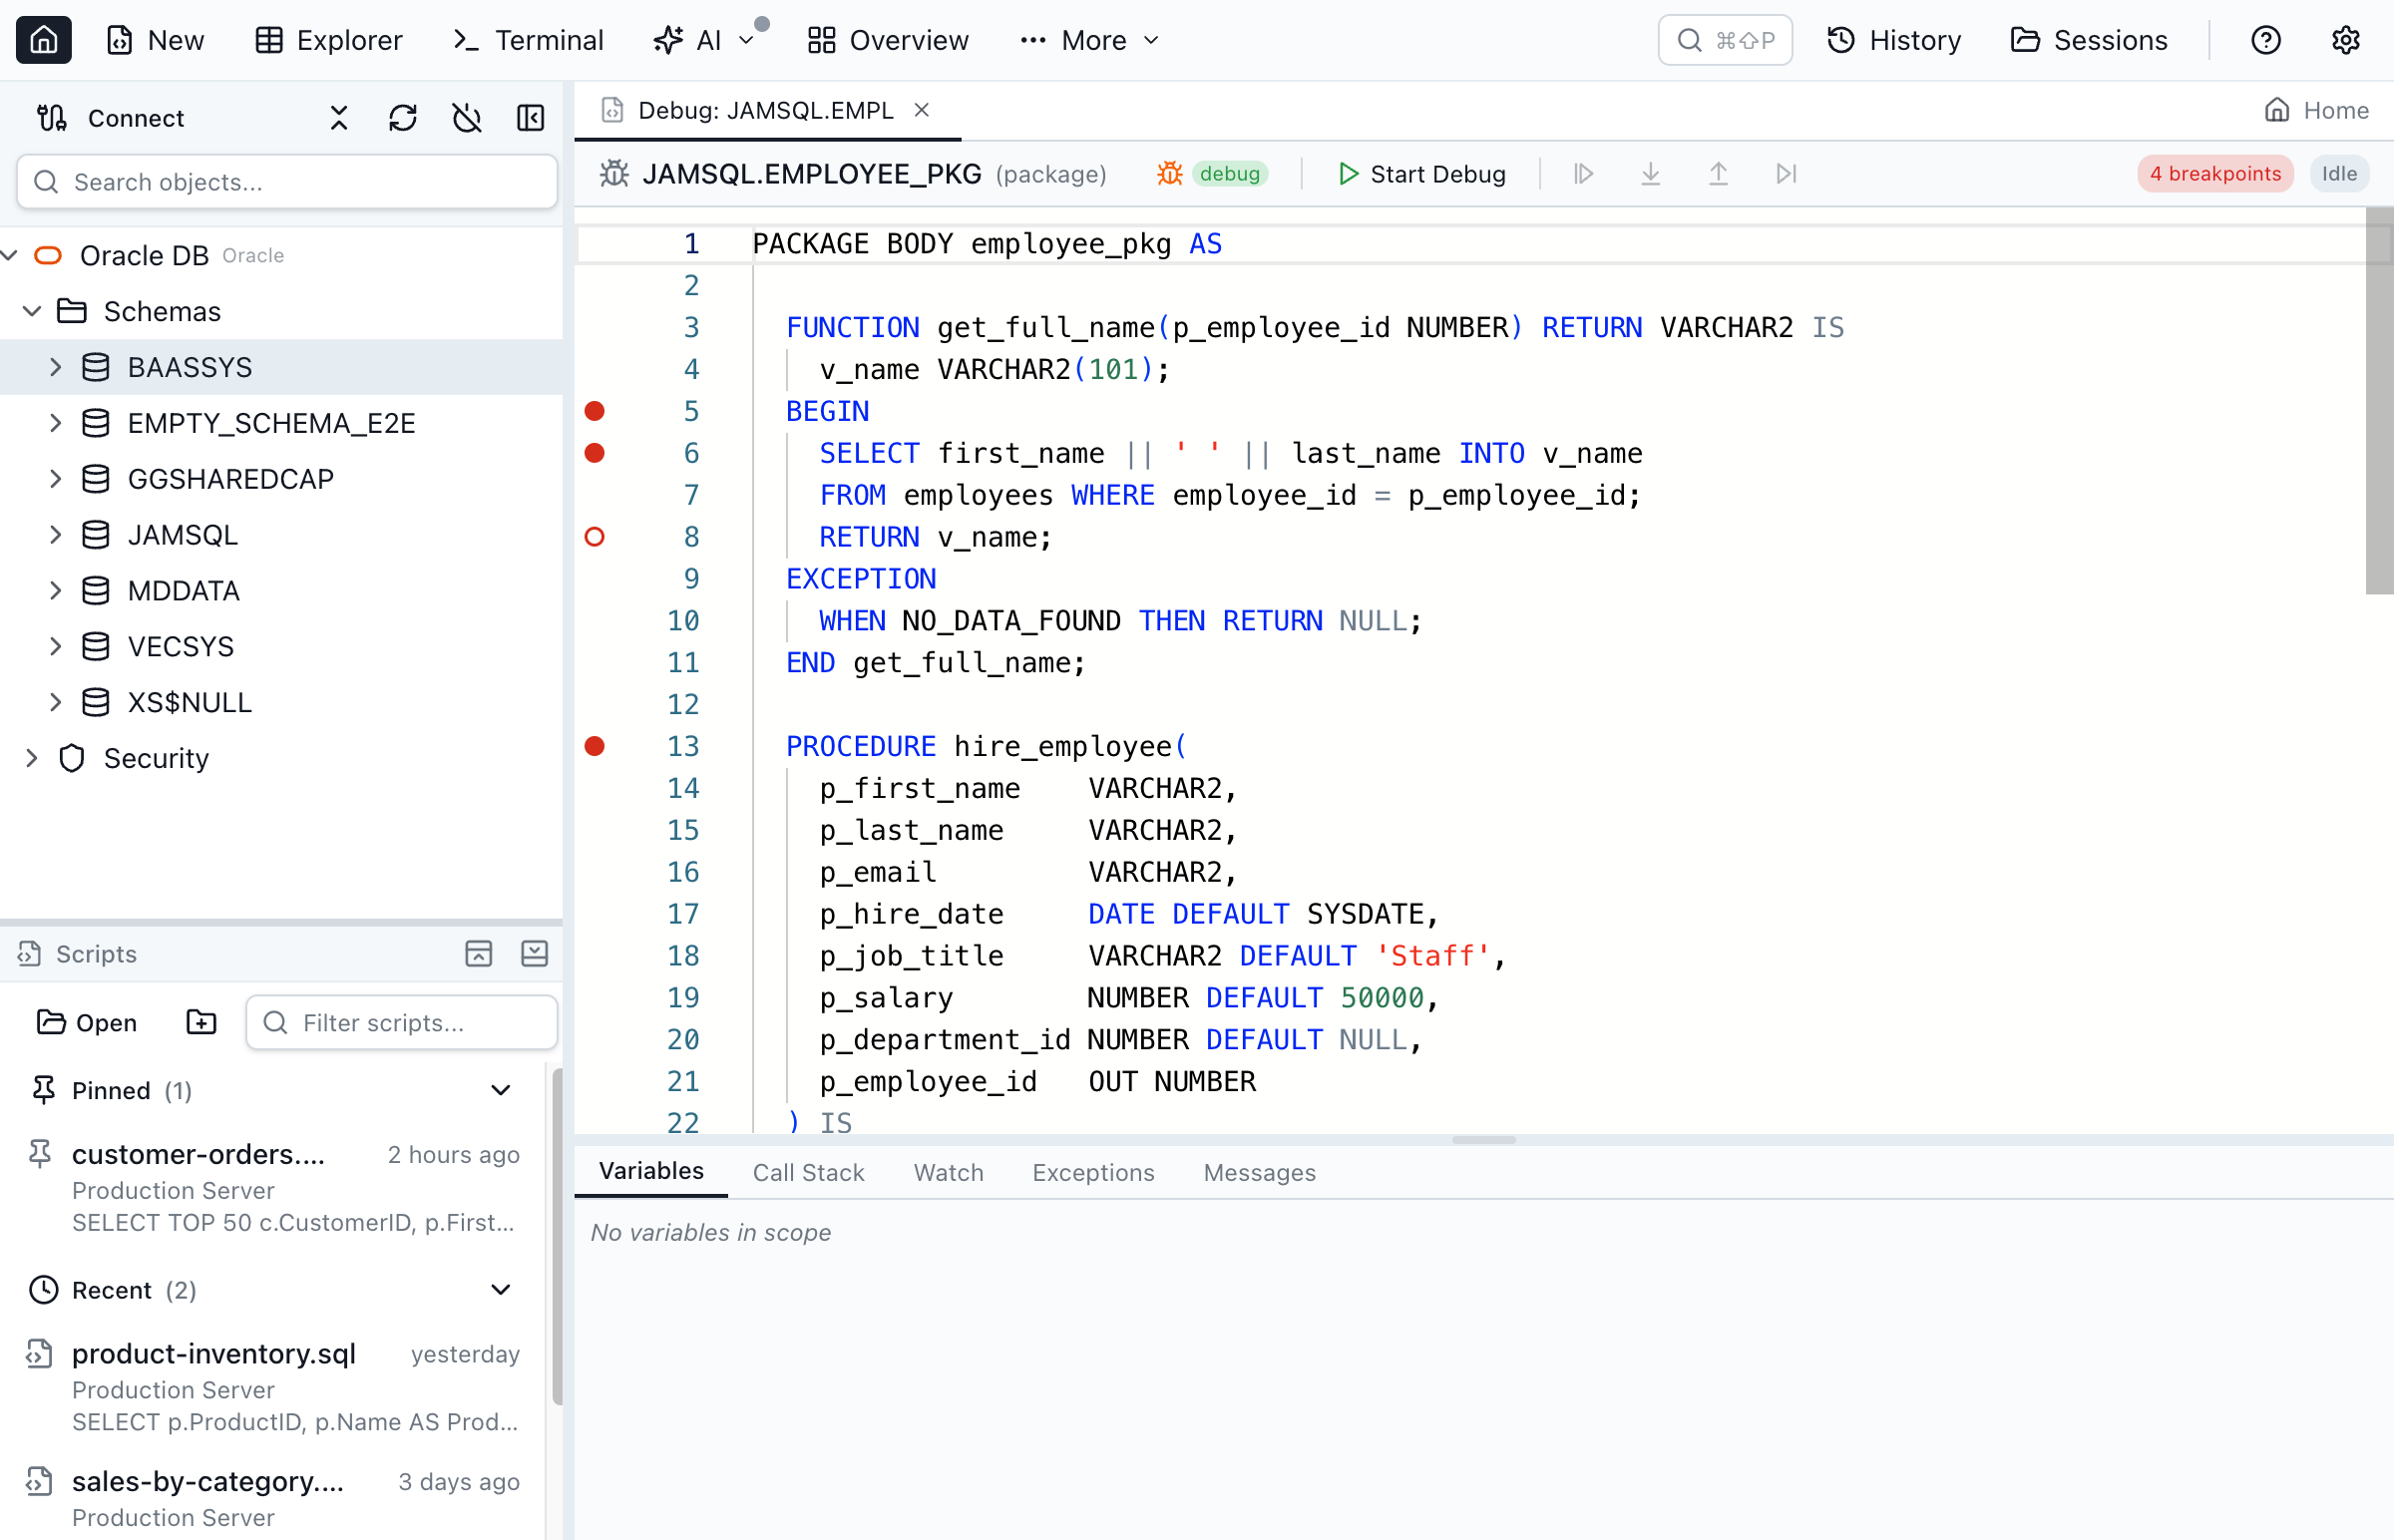
Setting Breakpoints
Click in the editor gutter (the margin to the left of line numbers) to toggle a breakpoint. Breakpoints are shown as red circles.
- Add breakpoint — click an empty gutter area
- Remove breakpoint — click an existing red circle, or right-click and select Remove Breakpoint
- Disable breakpoint — right-click a breakpoint and select Disable Breakpoint. Disabled breakpoints appear as hollow red circles.
- Remove all breakpoints — right-click the gutter and select Remove All Breakpoints
Breakpoints persist across tab switches and are synced to Oracle's DBMS_DEBUG.SET_BREAKPOINT when the debug session starts. The debug toolbar shows the current breakpoint count.
Starting a Debug Session
- Set your breakpoints in the source code
- Click Start Debug in the toolbar
- For stored program units, a dialog appears pre-populated with a PL/SQL call template (e.g.,
BEGIN schema.package_name.procedure_name(); END;). Edit the parameters as needed and click Start. - For anonymous blocks, the source is used directly — no dialog needed
- The debugger initializes a dual-session connection (target + debug), syncs your breakpoints, and begins execution
- Execution pauses at the first breakpoint hit, highlighting the current line in yellow
Execution Controls
When paused at a breakpoint, use the toolbar buttons to control execution:
- Step Over — execute the current line and pause at the next line in the same scope
- Step Into — if the current line calls another procedure/function, enter that routine and pause at its first line
- Step Out — run until the current routine returns, then pause in the caller
- Continue — resume execution until the next breakpoint or program termination
- Stop Debug — abort the debug session and return to idle state
The debug toolbar shows the current state (Initializing, Running, Paused, Stopped) with color-coded badges.
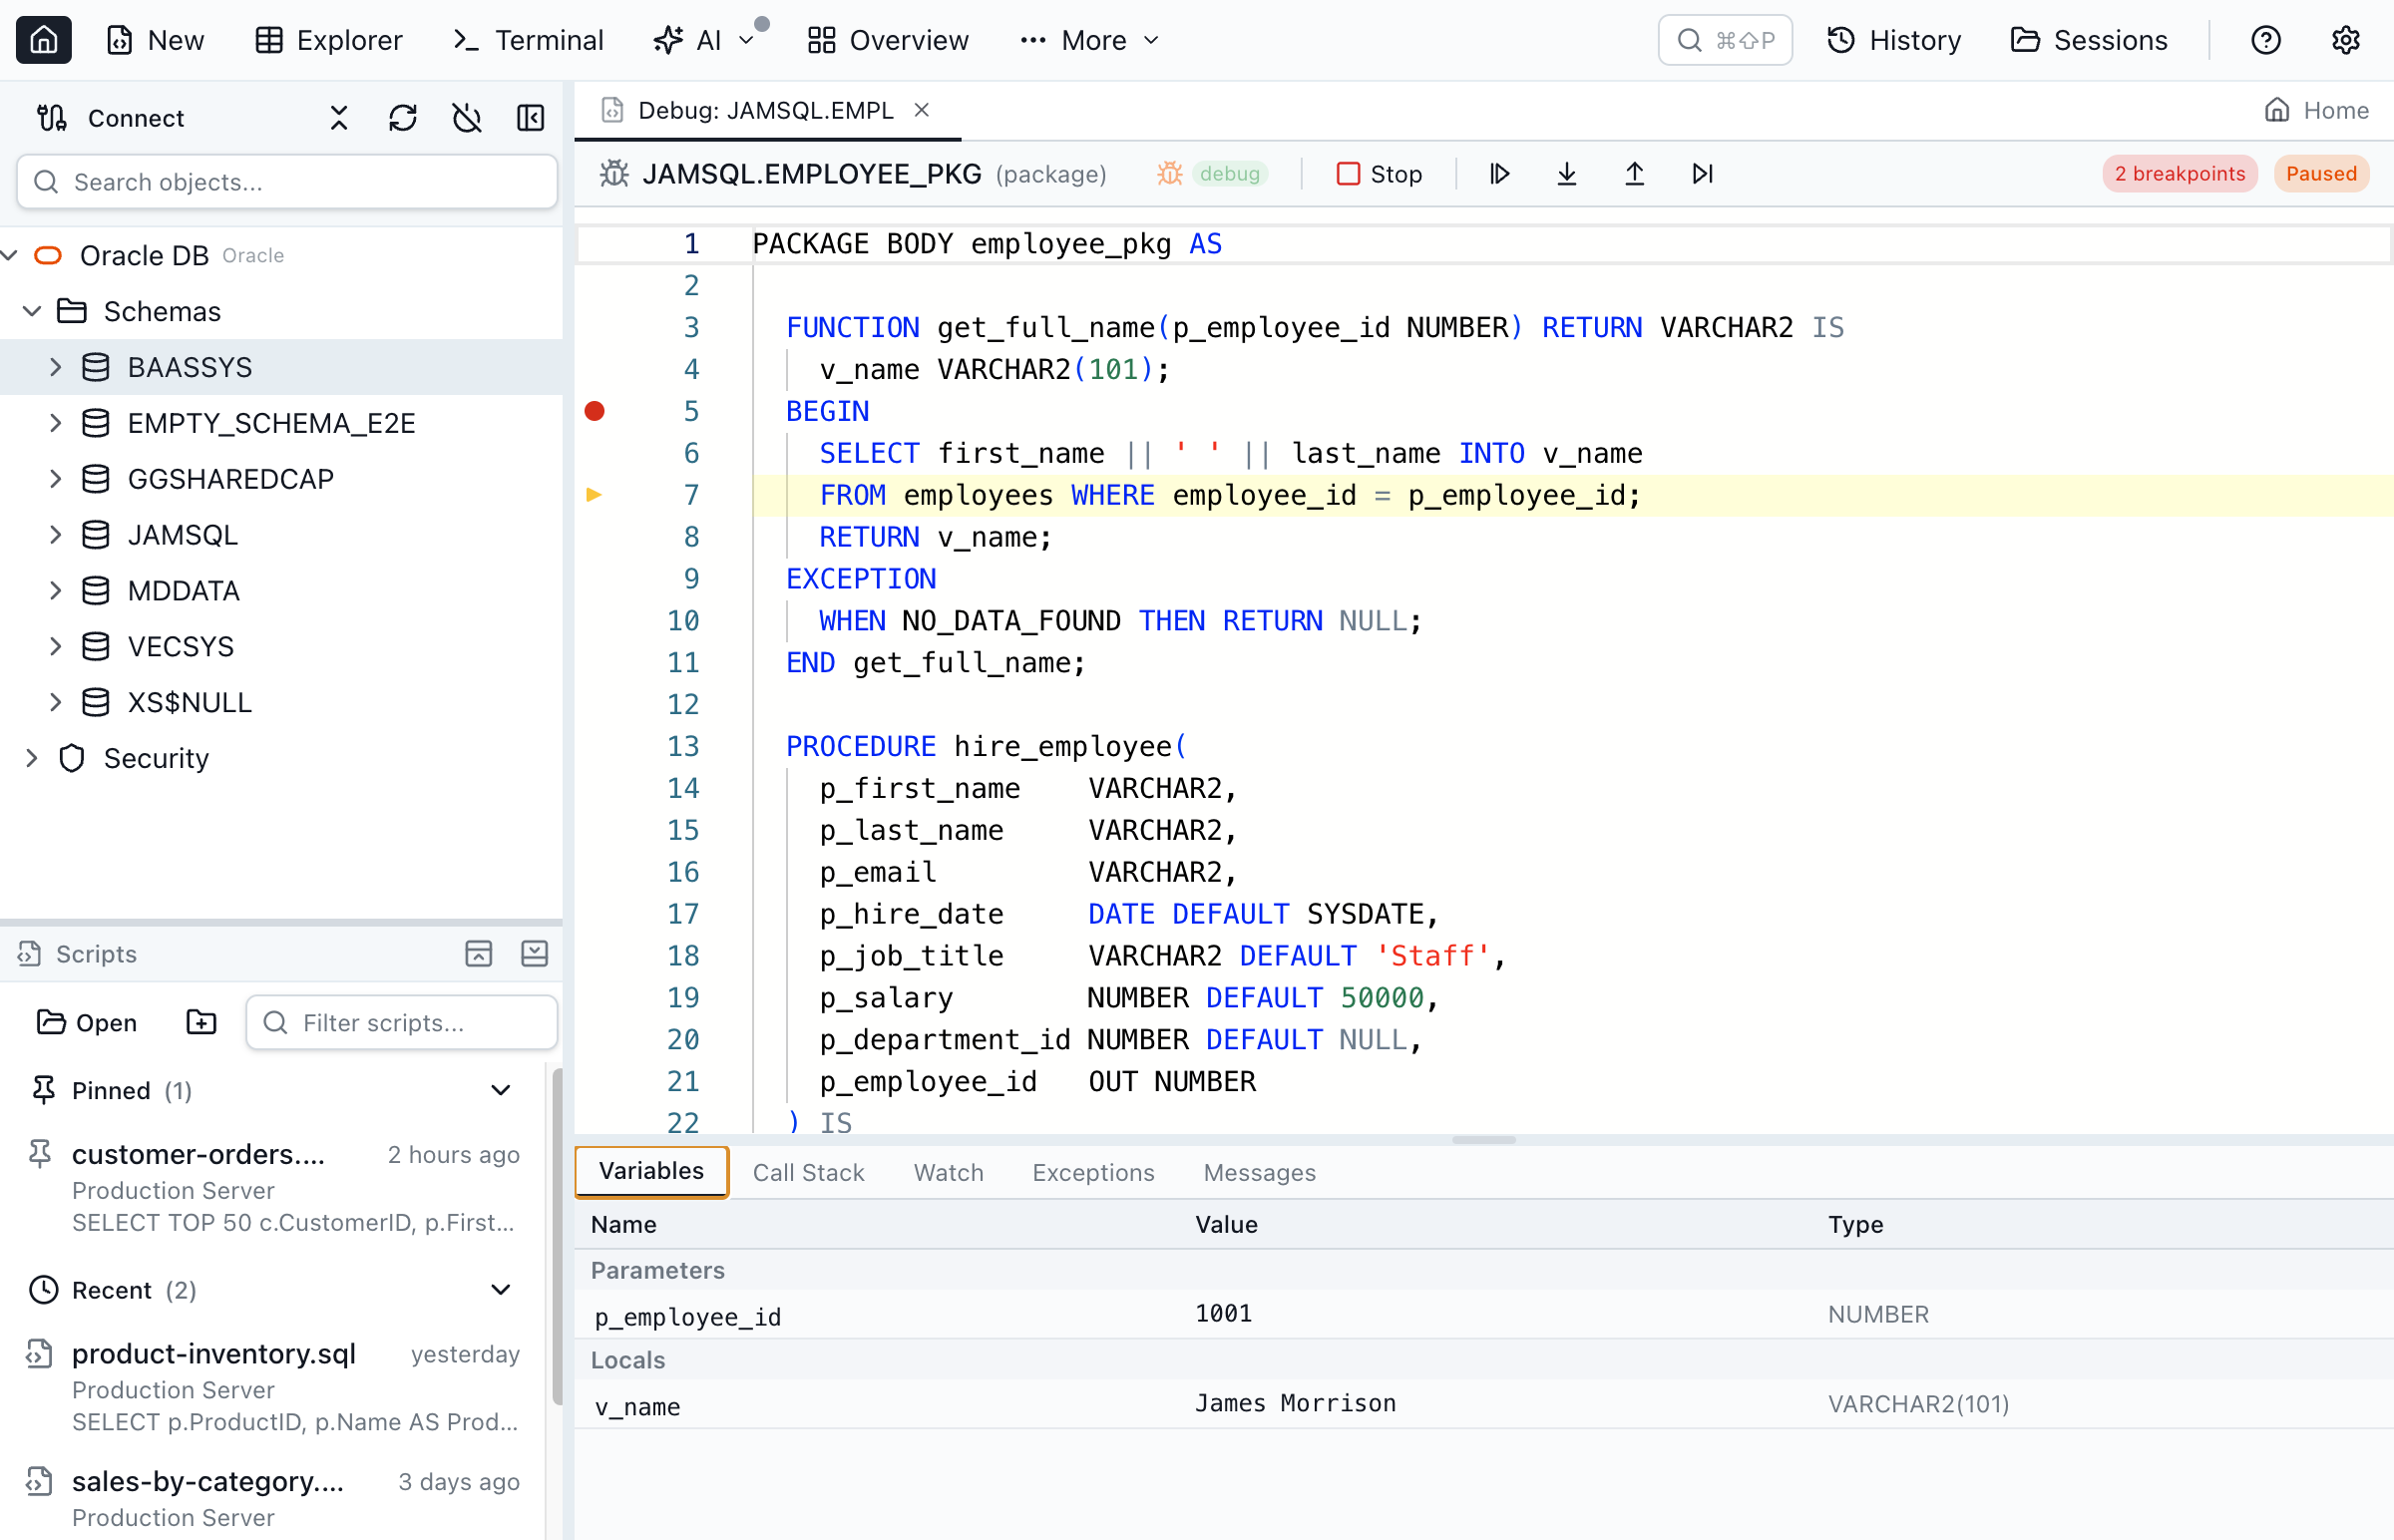
Variable Inspection
The Variables panel in the bottom area shows the current values of all in-scope variables, organized by category:
- Parameters — procedure/function arguments (IN, OUT, IN OUT)
- Locals — variables declared in the current subprogram
- Package Variables — package-level variables (for package body debugging)
Each variable shows its name, current value, and data type. NULL values are displayed in italic. Double-click any value to copy it to the clipboard.
Variables refresh automatically after each step or breakpoint pause.
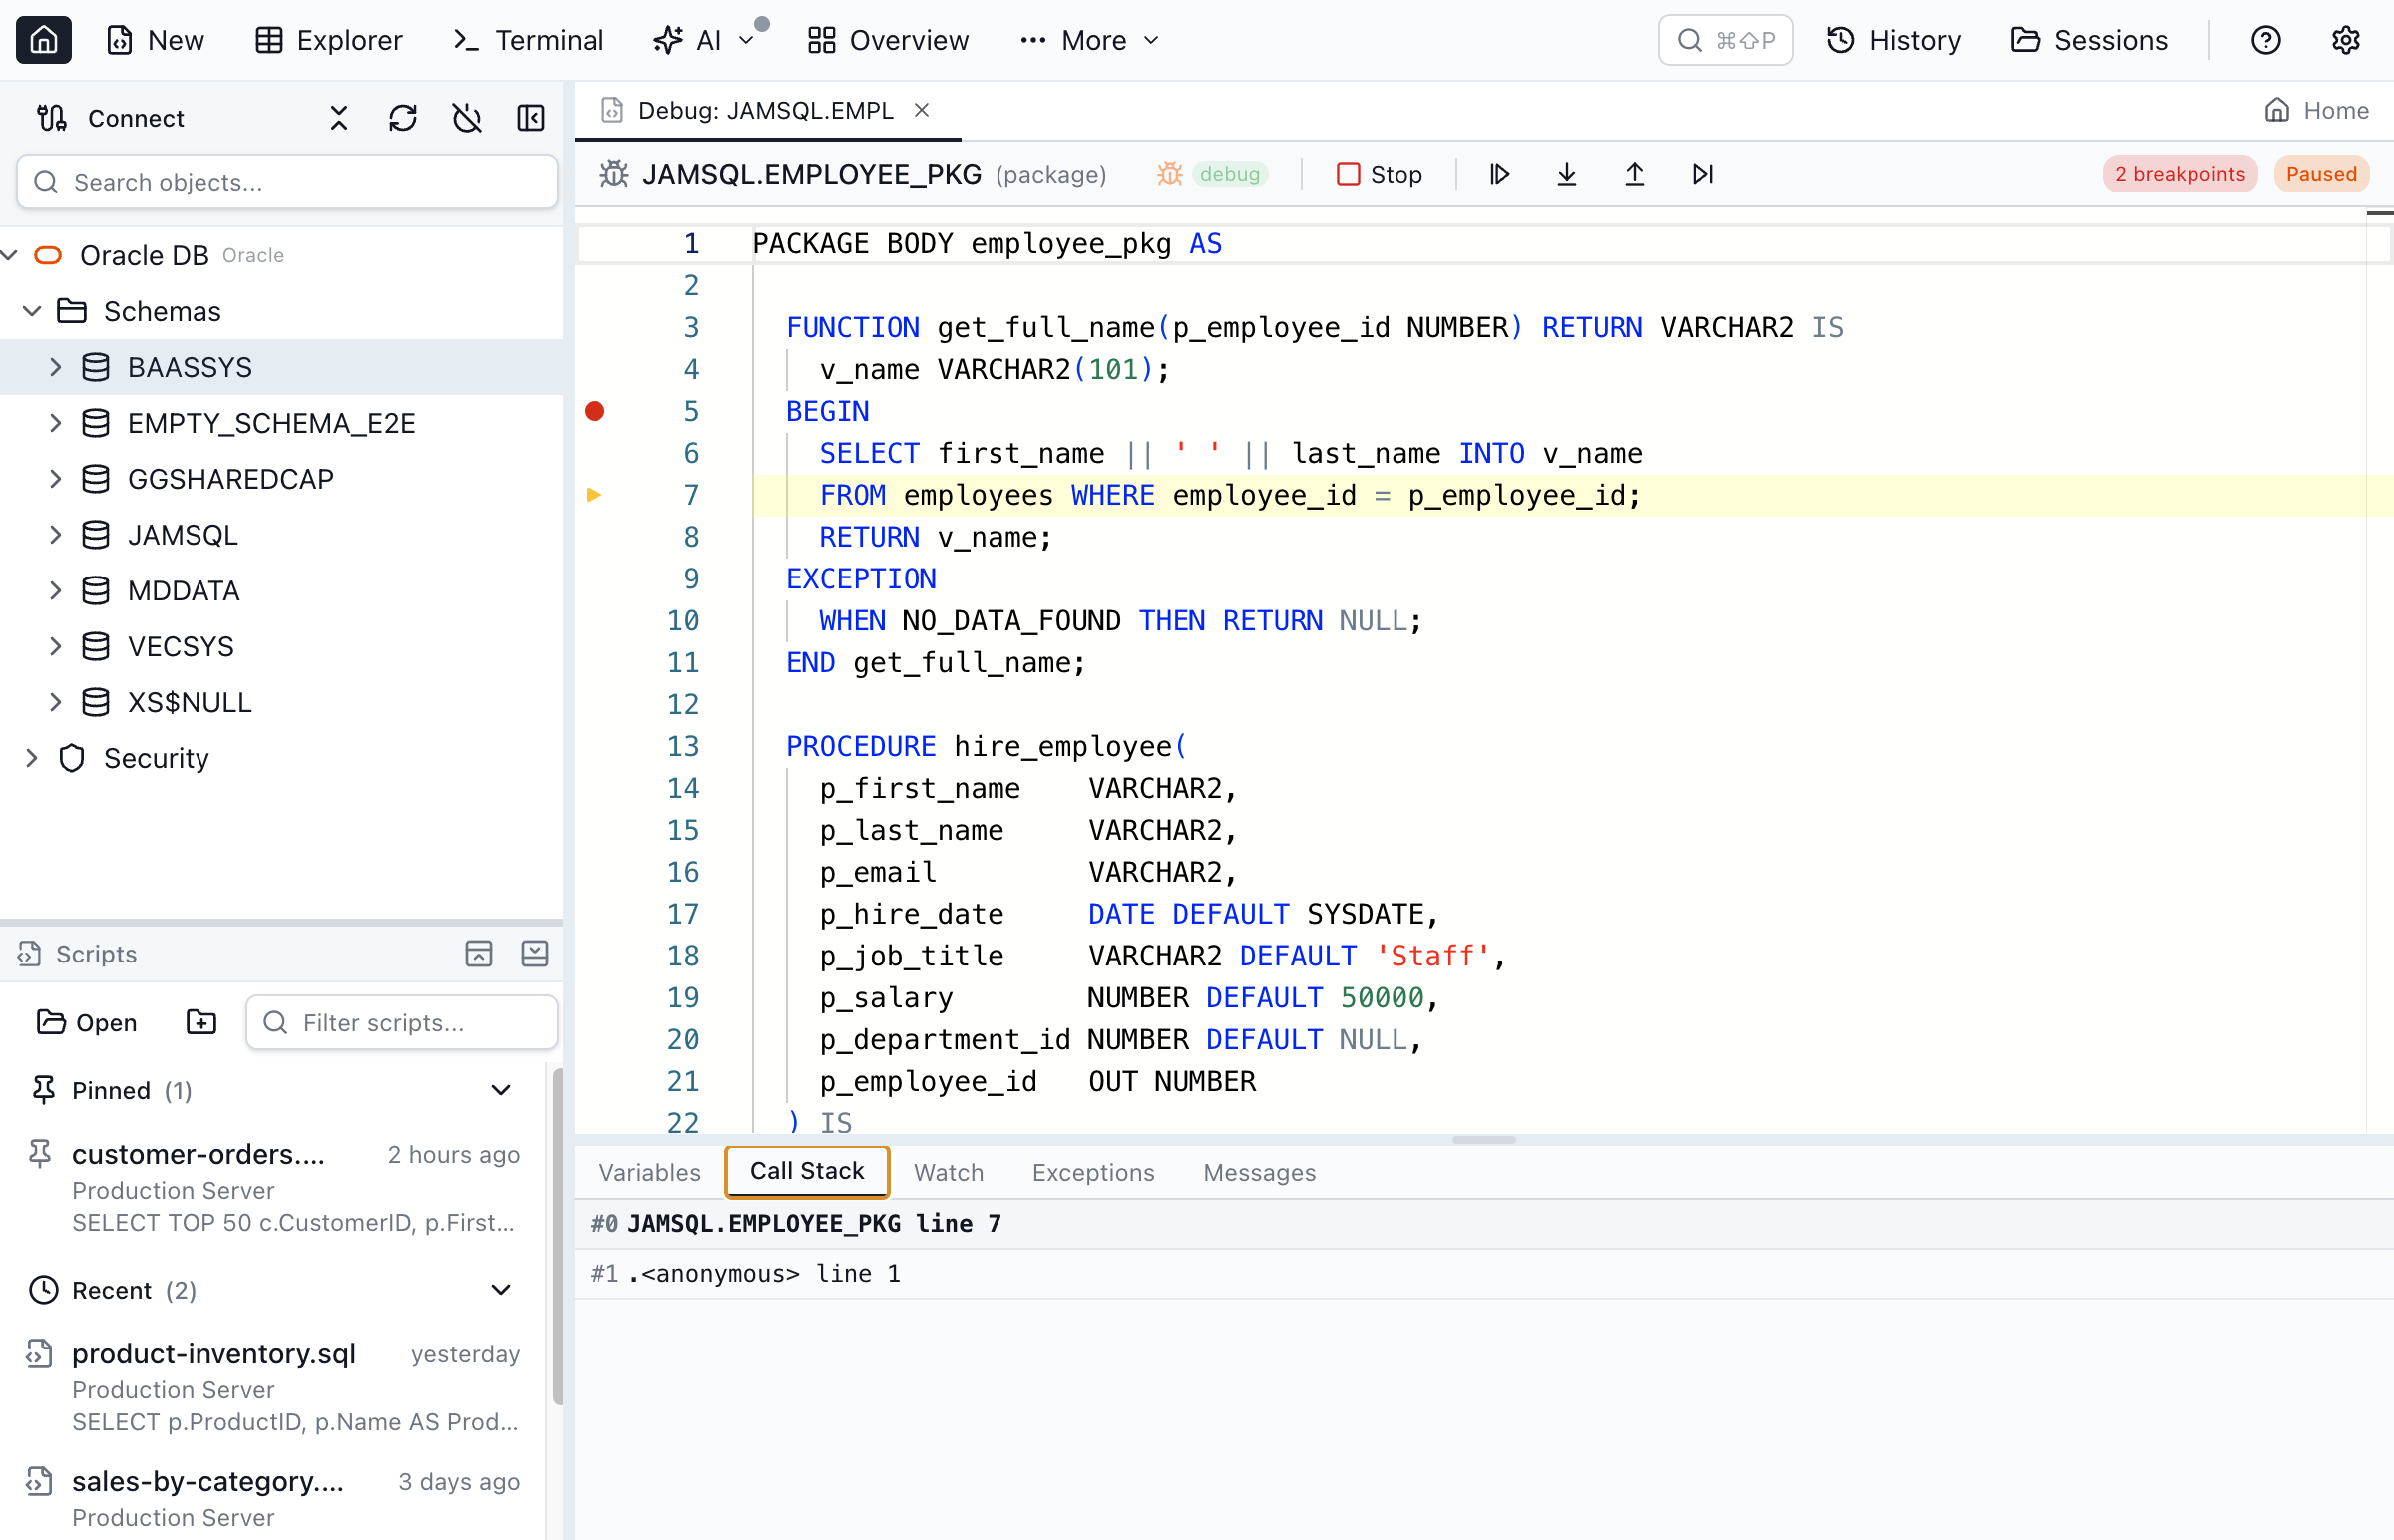
Call Stack
The Call Stack panel shows the chain of program units that led to the current execution point. The topmost frame is the currently executing routine.
- Each frame shows
OWNER.PROGRAM_NAME line N - Click a frame to navigate to that source location — the editor loads the frame's source and the Variables panel updates to show that frame's variables
- When stepping into a different program unit (e.g., from an anonymous block into a package function), the editor automatically loads the new source
Watch Expressions
The Watch panel lets you evaluate arbitrary PL/SQL expressions in the context of the current debug session:
- Type an expression in the input field and press Enter to add it
- Supported expressions: variable names (
v_count), qualified names (pkg.var), record fields (rec.field), collection elements (arr(1)), function calls (LENGTH(v_name)), arithmetic (v_salary * 12) - All watches re-evaluate automatically after each step or breakpoint pause
- Double-click an expression to edit it
- Evaluation errors are shown in red
Watch expressions persist in the tab state and survive tab switching.
Exception Breakpoints
The Exceptions panel lets you configure the debugger to pause when exceptions are raised:
- Break on All Exceptions — toggle this checkbox to pause whenever any unhandled exception occurs during execution
- Named Exceptions — add specific Oracle exceptions (NO_DATA_FOUND, TOO_MANY_ROWS, VALUE_ERROR, ZERO_DIVIDE, etc.) to break on only those exceptions
When an exception breakpoint fires, the current line highlights the statement that raised the exception. You can inspect variables and the call stack at the point of failure, then continue to let the exception propagate to any handlers.
Debugging Anonymous Blocks
Anonymous PL/SQL blocks can be debugged directly from the Query Editor without compiling for debug. This is useful for:
- Testing a procedure call with specific parameters
- Debugging ad-hoc PL/SQL logic
- Stepping into stored procedures called from the block
The Debug button appears in the Query Editor toolbar whenever the editor content starts with BEGIN, DECLARE, or CREATE and the active connection is Oracle.
DBMS_OUTPUT Capture
Any output from DBMS_OUTPUT.PUT_LINE during the debug session is captured and displayed in the Messages panel when the program finishes or is stopped. This lets you see print-style debug output alongside the step-through debugger.
Troubleshooting
Missing Privileges
If you see a "missing privileges" error, ask your DBA to grant:
GRANT DEBUG CONNECT SESSION TO your_user;
GRANT DEBUG ANY PROCEDURE TO your_user;
GRANT EXECUTE ON SYS.DBMS_DEBUG TO your_user;
Breakpoints Not Hit
Ensure the program unit is compiled with debug information. In the Package Browser, check for the green "debug" badge. If missing, click Compile Debug. You can verify with:
SELECT name, plsql_debug
FROM ALL_PLSQL_OBJECT_SETTINGS
WHERE owner = 'YOUR_SCHEMA' AND name = 'YOUR_OBJECT';
Session Timeout
If the debug session times out, the target program may not have reached a breakpoint within the timeout period (60 seconds). Check that your breakpoints are on executable lines (not blank lines or comments) and that the PL/SQL call actually reaches those lines.
Key Capabilities
- Step-through debugging - Step Into, Step Over, Step Out, and Continue through PL/SQL code
- Breakpoint management - Set, remove, disable, and enable breakpoints with gutter click
- Variable inspection - View parameters, locals, and package variables with current values
- Call stack navigation - Navigate frames and inspect variables at each level
- Watch expressions - Evaluate arbitrary PL/SQL expressions in debug context
- Exception breakpoints - Break on all exceptions or specific named exceptions
- Anonymous block debugging - Debug ad-hoc PL/SQL from the Query Editor
- Cross-platform - Works on macOS, Windows, and Linux with no extra Oracle Client needed
Ready to Debug PL/SQL?
Download Jam SQL Studio and start debugging Oracle stored procedures today.