Published: 2026-03-19
PL/SQL Debugging on Mac and Linux: The Gap Nobody Filled (Until Now)
If you write PL/SQL on a Mac or Linux machine, you've probably accepted that step-through debugging isn't something your tools can do. Toad was Windows-only. PL/SQL Developer still is. DBeaver has had an open issue for it since 2018. SQL Developer technically works but starts slower than some of your procedures run. Jam SQL Studio changes this — a native, fast PL/SQL debugger that works on every platform.
The State of PL/SQL Debugging in 2026
PL/SQL debugging should be a solved problem. Oracle introduced DBMS_DEBUG in Oracle 8i — nearly three decades ago. Yet for developers on macOS and Linux, the landscape is surprisingly barren.
Here's what PL/SQL debugging actually looks like across tools in 2026:
| Tool | Platforms | PL/SQL Debugger | Price |
|---|---|---|---|
| Toad for Oracle | Windows, Mac (2025) | Yes | ~$928–$2,179/yr |
| PL/SQL Developer | Windows only | Yes | $238 |
| DataGrip | All platforms | Yes (deprecated API) | $299/yr (free non-commercial) |
| Oracle SQL Developer | All platforms | Yes | Free |
| SQL Developer for VS Code | All platforms | Yes (since Oct 2024) | Free |
| dbForge Studio for Oracle | All platforms (recent) | Yes (Standard+) | From $300 |
| DBeaver | All platforms | No (requested since 2018) | Free / $25/mo Pro |
| Beekeeper Studio | All platforms | No | Free / $7/mo |
| Jam SQL Studio | All platforms | Yes | Free (personal) |
Look at that table. If you're on macOS or Linux, your realistic options for PL/SQL debugging are: Oracle's own tools (heavyweight Java Swing or a new VS Code extension), DataGrip (which uses a deprecated debug protocol), or paying $300+ for dbForge or $928+/yr for Toad. DBeaver — arguably the most popular cross-platform database tool — still can't do it after 8 years of user requests.
Why Is PL/SQL Debugging So Hard to Build?
The reason DBeaver hasn't shipped this in 8+ years — and why most cross-platform tools skip it — comes down to Oracle's debugging architecture. There are two approaches, and both have sharp edges.
DBMS_DEBUG (The Session-Based Approach)
Introduced in Oracle 8i, DBMS_DEBUG uses a dual-session model. One database session runs your PL/SQL code (the target session), while a second session (the debug session) controls execution — setting breakpoints, stepping through lines, inspecting variables.
- Advantage: Everything happens inside the database. No network configuration, no firewall rules, no reverse connections. All debug operations are PL/SQL calls over your existing connection.
- Disadvantage: Oracle deprecated it in 12.2 in favor of JDWP. It hasn't been removed (still works in 26ai), but it carries the stigma of deprecation.
DBMS_DEBUG_JDWP (The Network-Based Approach)
Oracle's current recommended approach uses the Java Debug Wire Protocol over TCP. The database server connects back to your client — a reverse connection.
- Advantage: Officially supported, more powerful, works with Oracle Autonomous Database.
- Disadvantage: Requires your database server to initiate TCP connections to your machine. That means firewall rules, ACL configuration via
DBMS_NETWORK_ACL_ADMIN, and port management. If your database is in the cloud or behind a corporate firewall, this is a substantial infrastructure ask.
Even Oracle recognized this was a problem. Oracle SQL Developer originally only supported JDWP, but in version 20.2 they added back DBMS_DEBUG as a simpler alternative. When Oracle's own tool retreats to the legacy API because the modern one is too painful to set up, that says something.
How Jam SQL Studio Does It
Jam SQL Studio uses DBMS_DEBUG. This was a deliberate choice — we optimized for the developer experience of getting into a debug session quickly, without requiring your DBA to open firewall ports or configure ACLs.
Zero Infrastructure Setup
The entire debug workflow runs over your existing Oracle connection. No additional ports, no reverse TCP, no ACL configuration. You need two standard Oracle privileges:
GRANT DEBUG CONNECT SESSION TO your_user;
GRANT DEBUG ANY PROCEDURE TO your_user;
Jam SQL Studio detects when these privileges are missing and shows you the exact GRANT statement. No hunting through Oracle documentation or Stack Overflow.
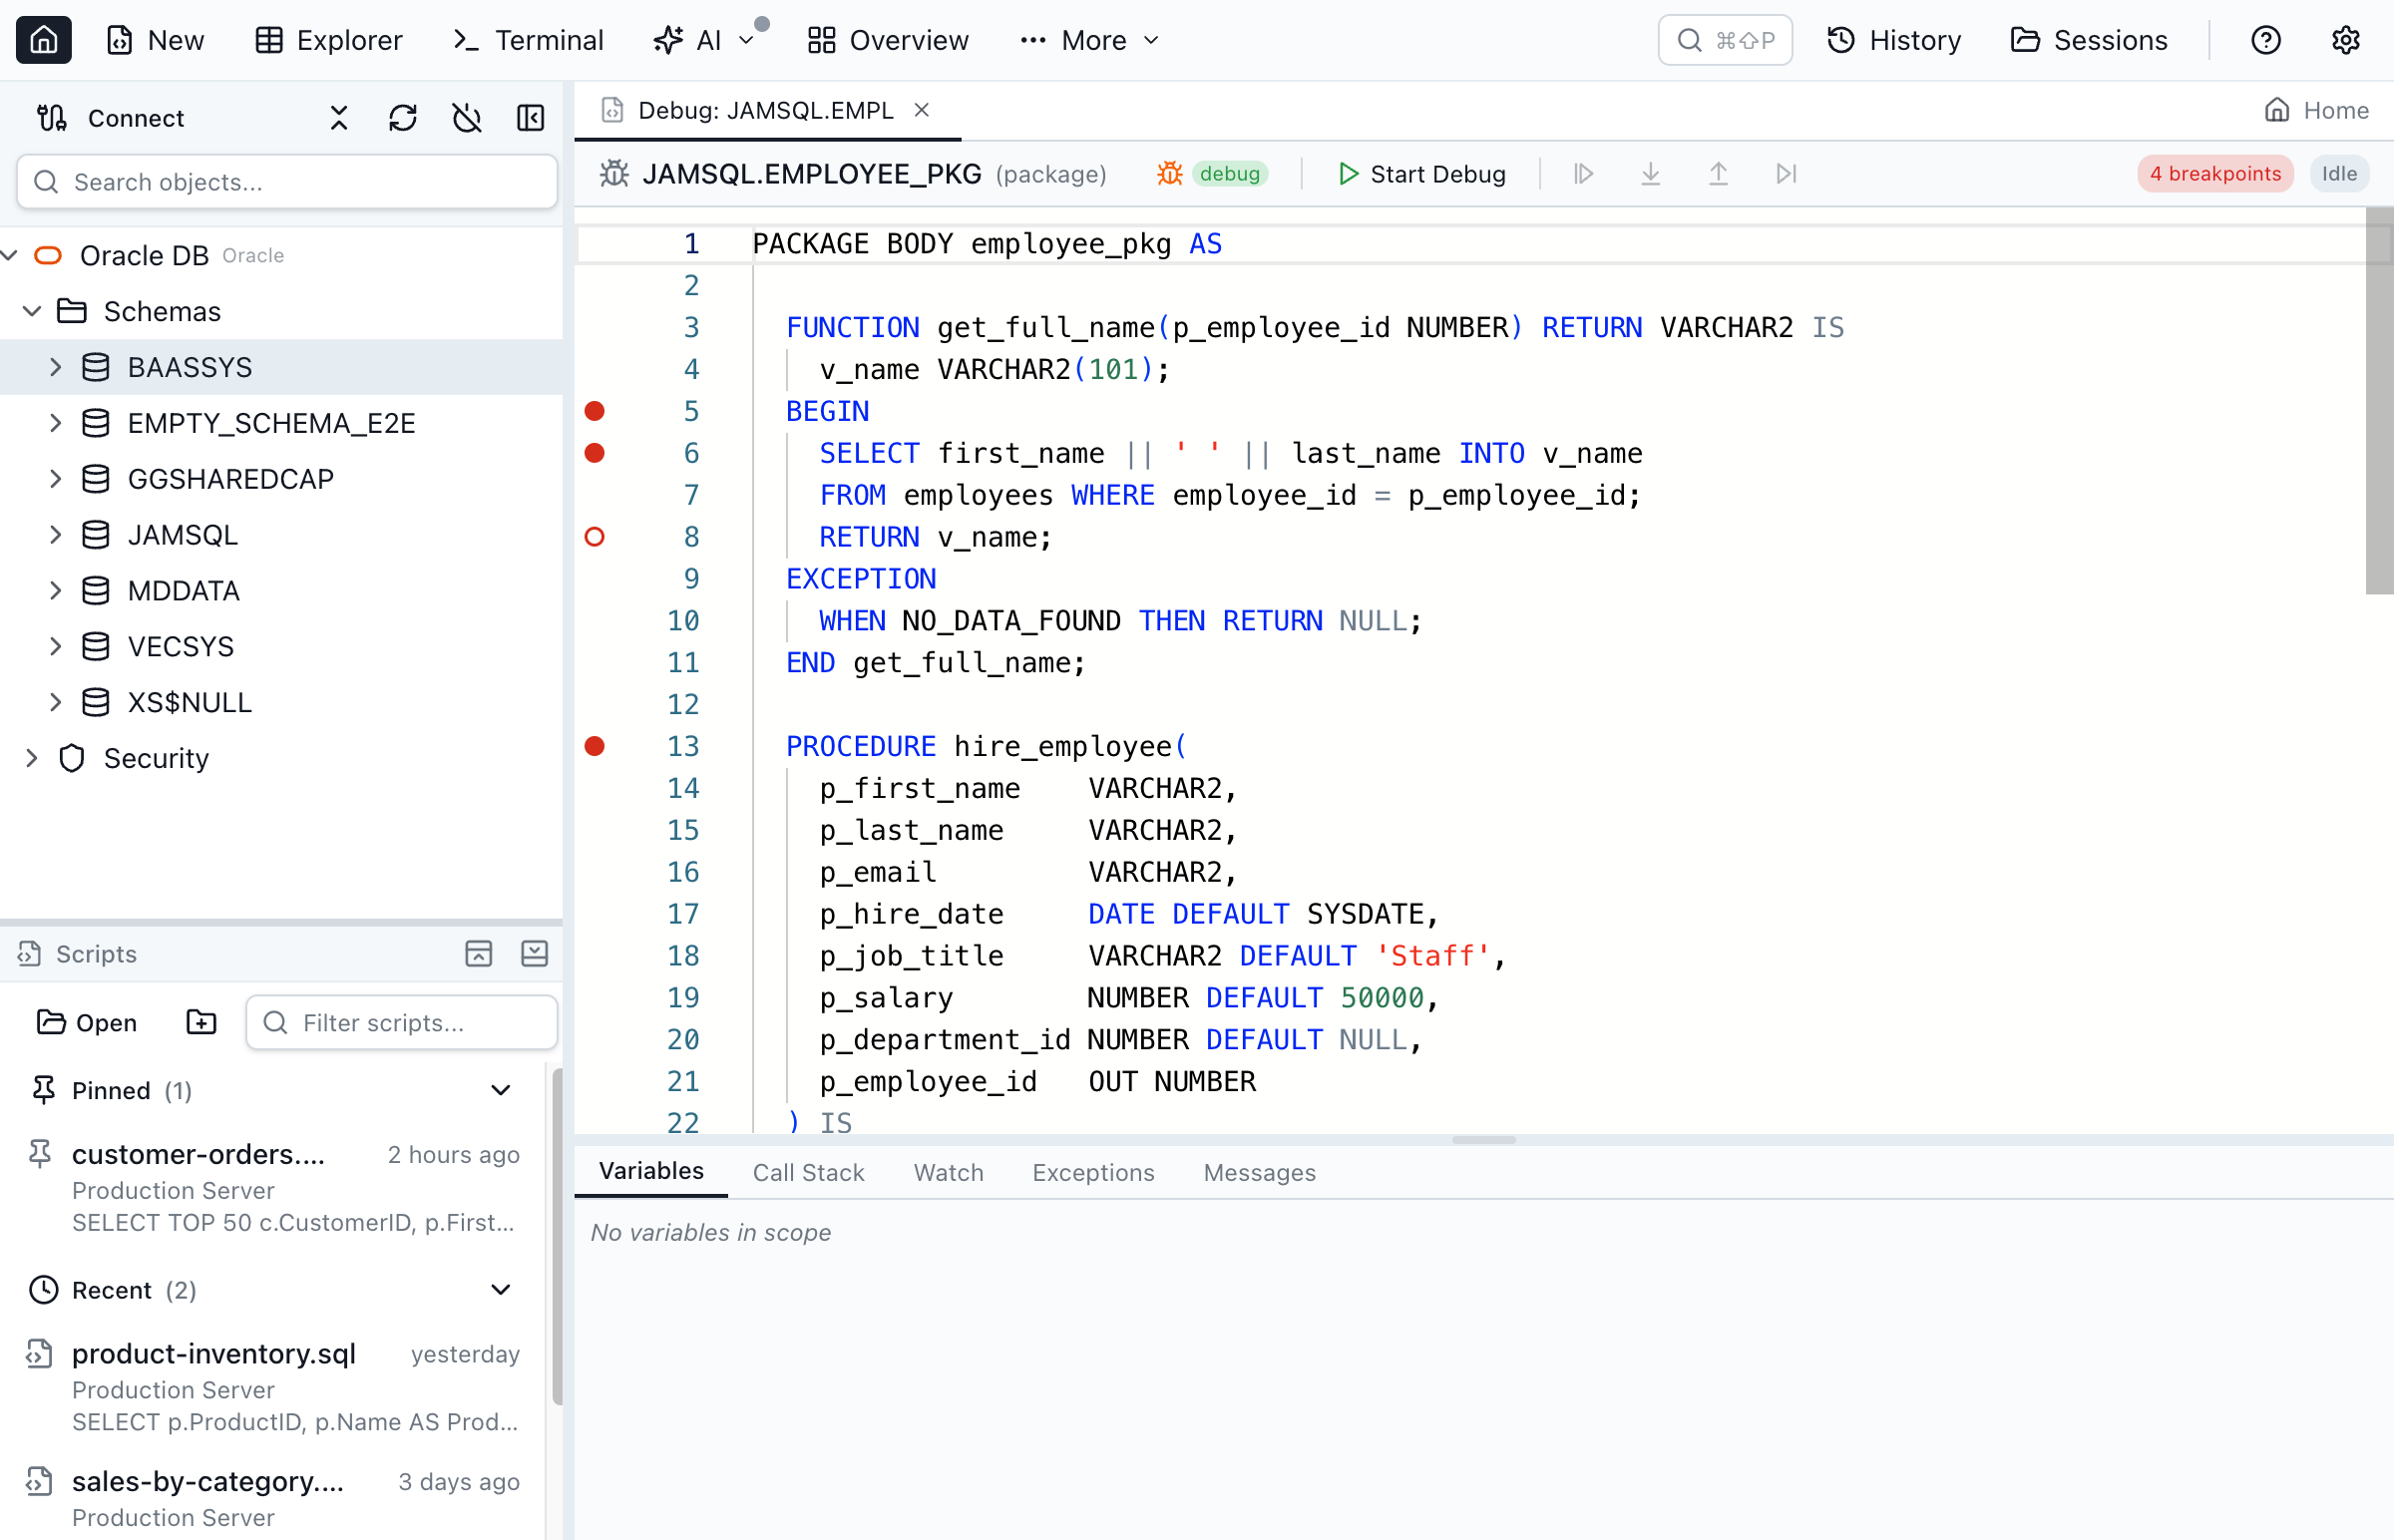
Three Ways to Start Debugging
Open the debugger from wherever you're already working:
- Package Browser — click the "Debug" button in the toolbar while viewing a package body
- Object Explorer — right-click any procedure, function, package, or trigger and select "Debug"
- Query Editor — write an anonymous PL/SQL block and click the bug icon in the toolbar
Full Debugging Feature Set
This isn't a watered-down "set a breakpoint and pray" debugger. Jam SQL Studio's debugger has the features that Oracle developers actually need:
- Breakpoints — click the gutter to set/remove. Right-click for disable, remove all. Breakpoints persist across tab switches.
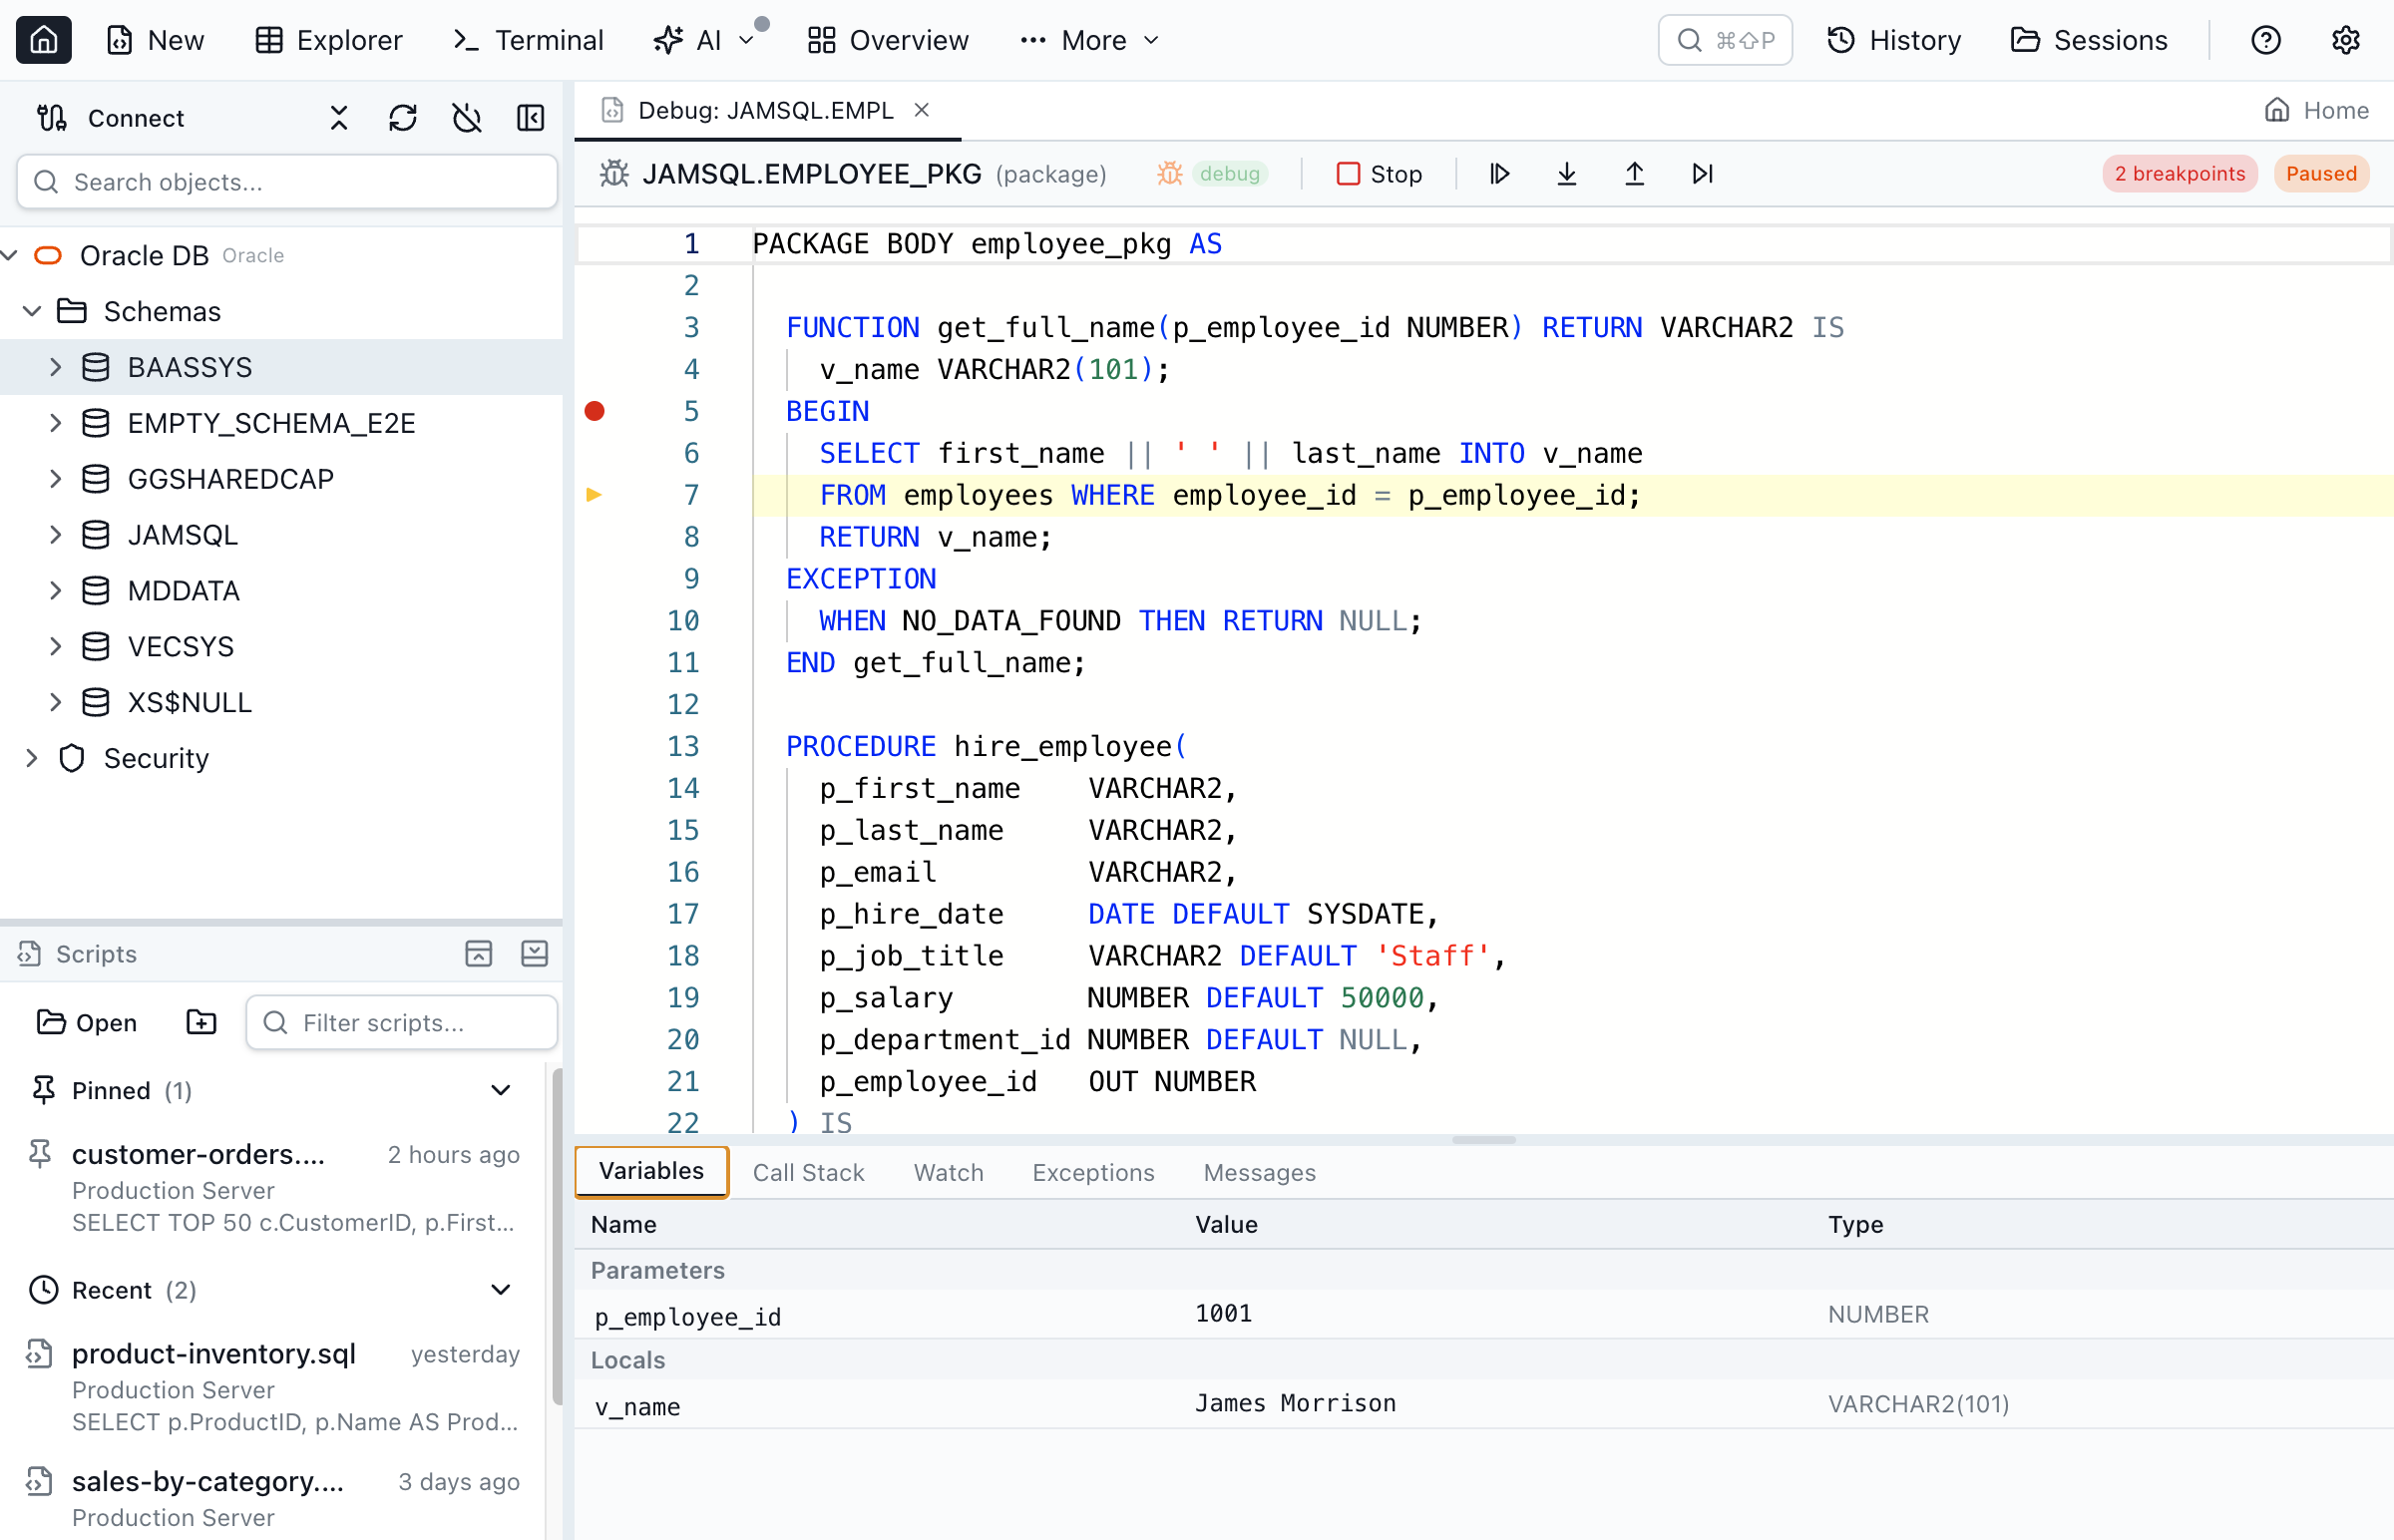
- Step Into / Step Over / Step Out / Continue — full execution control with keyboard shortcuts (F5, F10, F11, Shift+F11)
- Variable inspection — locals, parameters, and package variables with Oracle-type-aware display (NUMBER, VARCHAR2, DATE, BOOLEAN, records, collections)
- Call stack — see the full call chain. Click a frame to jump to that source location and inspect that frame's variables.
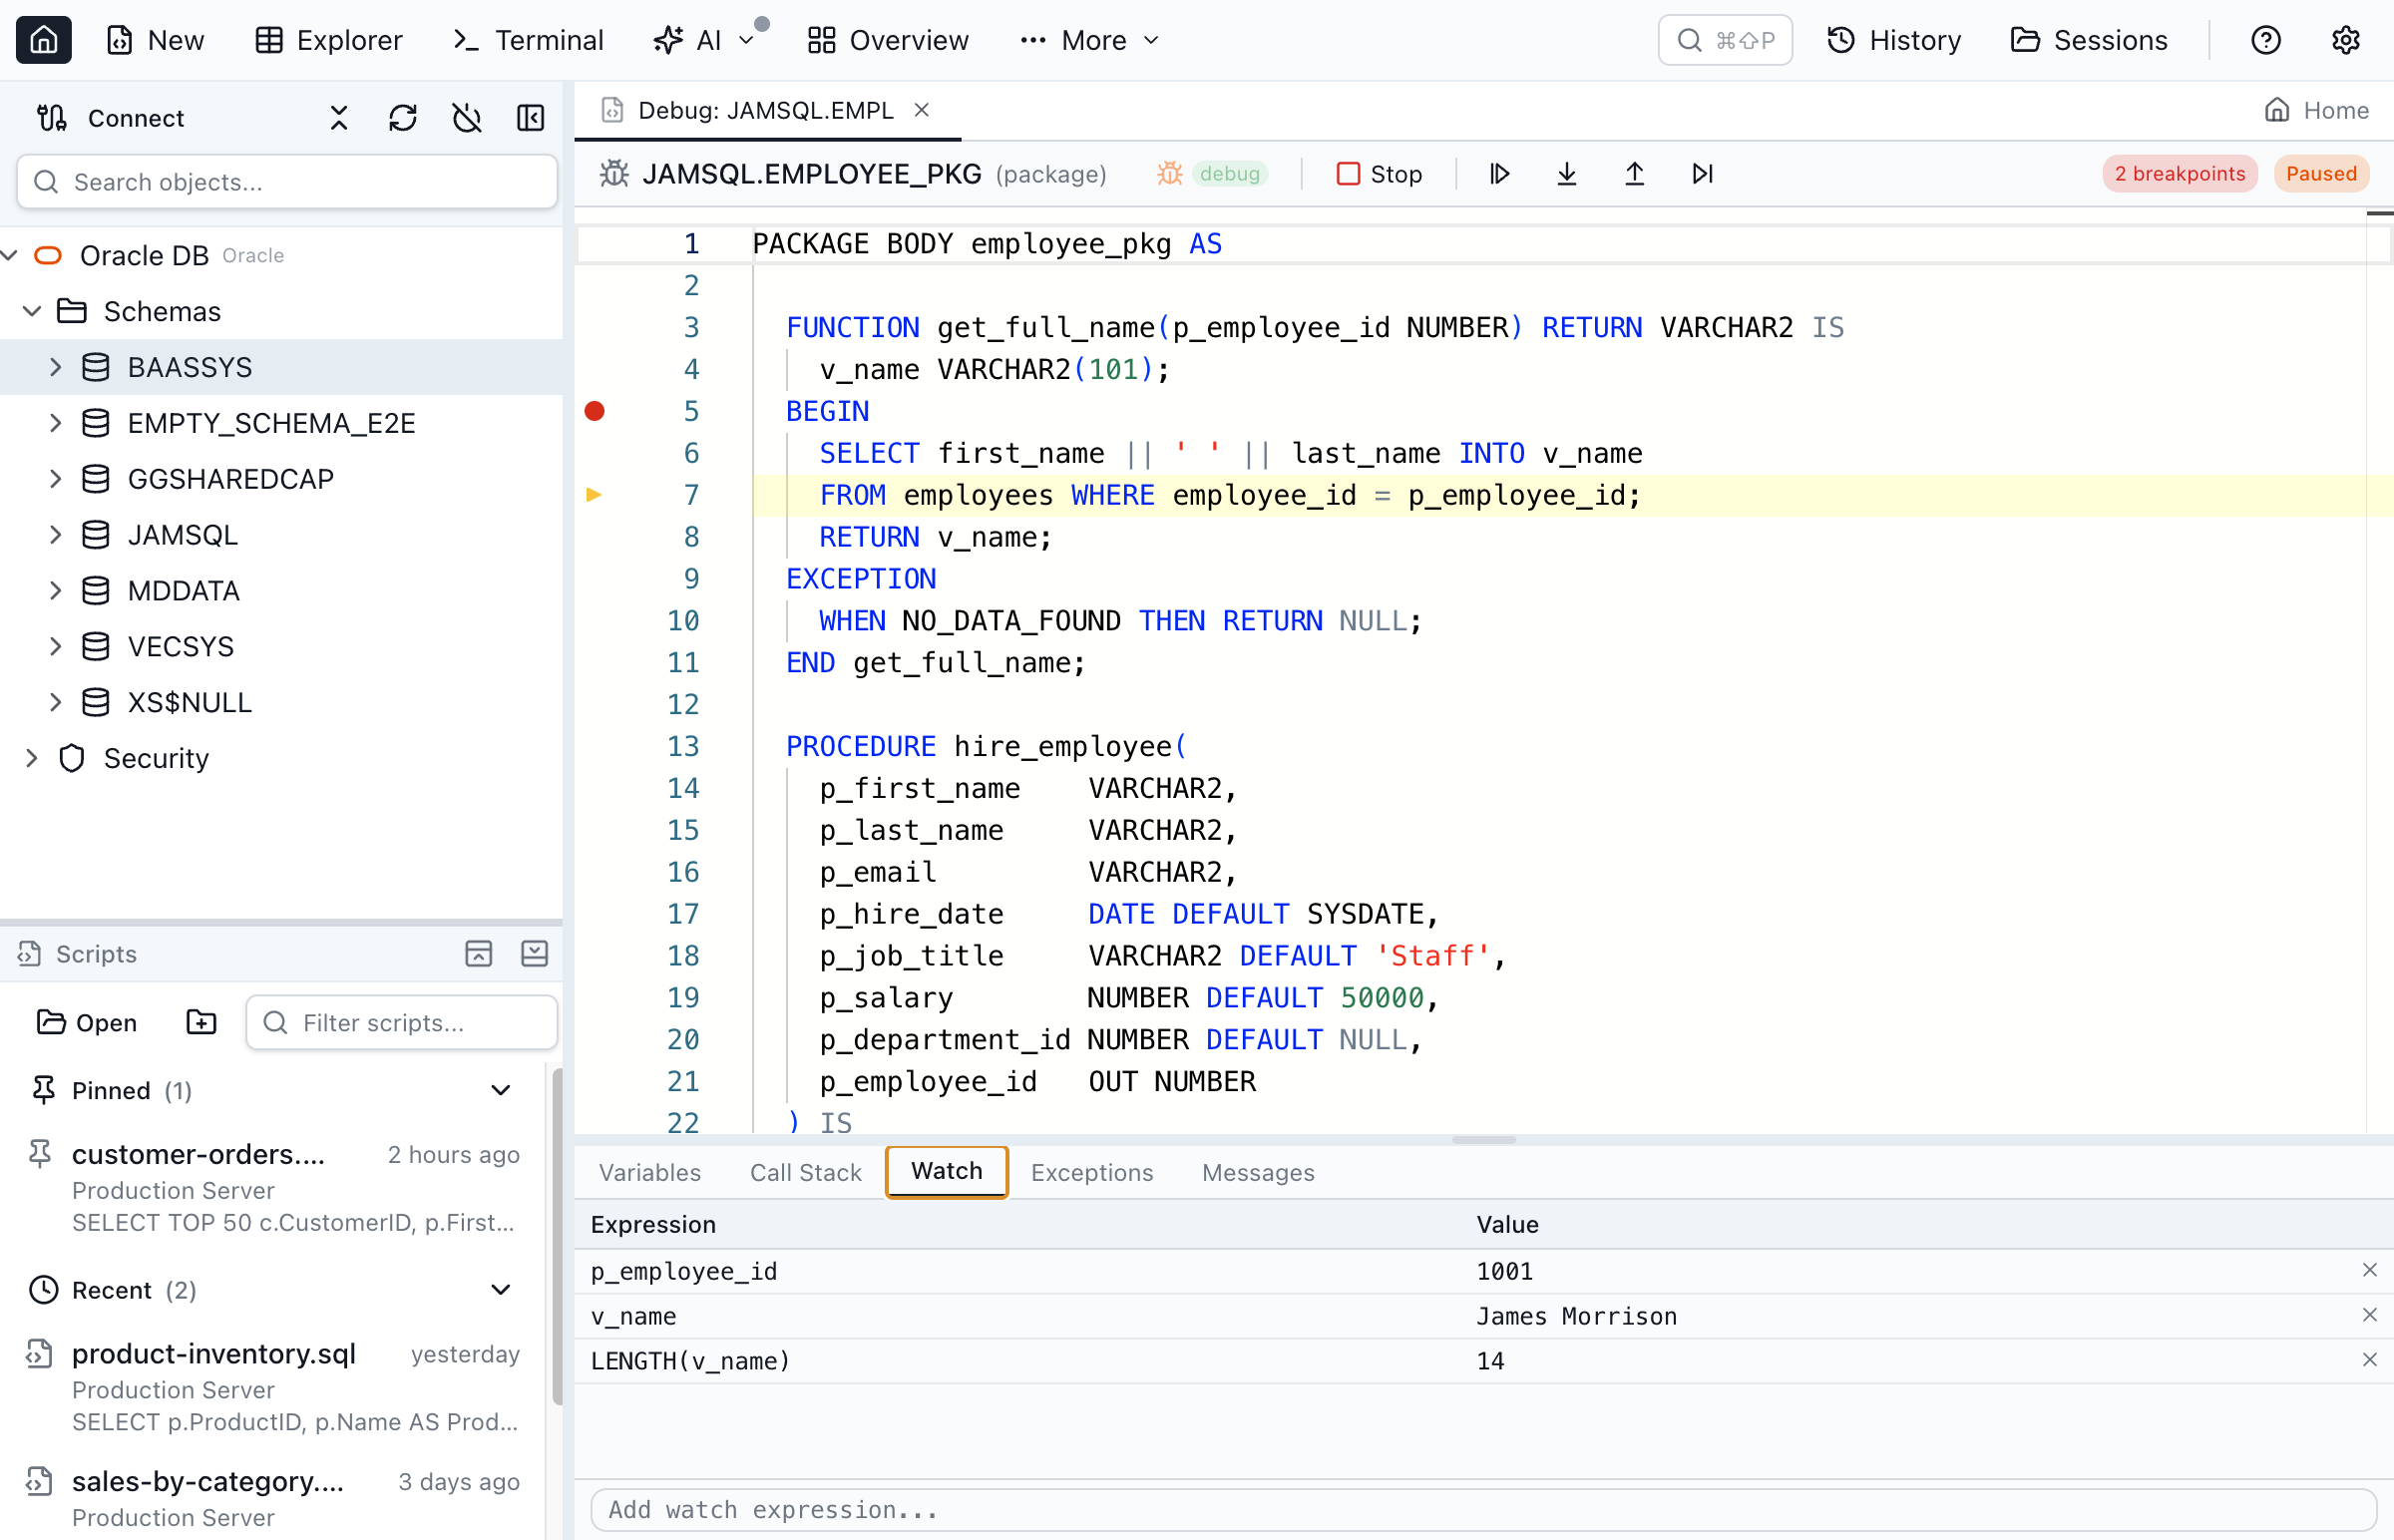
- Watch expressions — add custom expressions evaluated at each pause. Supports field access (
rec.field), collection indexing (arr(1)), and PL/SQL functions (LENGTH(v_name)). - Exception breakpoints — break on all exceptions or specific ones (NO_DATA_FOUND, TOO_MANY_ROWS, VALUE_ERROR). Inspect program state at the point of failure.
- Anonymous block debugging — debug ad-hoc PL/SQL from the query editor, stepping into called procedures
- DBMS_OUTPUT capture — output collected and displayed in the Messages panel
Compile for Debug in One Click
Oracle requires program units to be compiled with debug information before you can set breakpoints. Most tools make this a multi-step process — find the object, run an ALTER command, check the result.
In Jam SQL Studio, click "Compile Debug" in the Package Browser toolbar or right-click in the Object Explorer. The app runs ALTER ... COMPILE DEBUG, checks for compilation errors, and shows a debug badge when the object is ready. One click.
The DBeaver Story: 8 Years and Counting
DBeaver is an excellent tool. It's arguably the most popular cross-platform database client, with 40+ million downloads. But its debugging story is strictly PostgreSQL.
In April 2018, a user opened GitHub issue #3404: "Oracle Procedures/Packages Debug." The user called it "a key feature on enterprise environments." Eight years later, the issue remains open. A duplicate was filed in 2024 (#34236). Still no Oracle debugging.
This isn't a criticism of DBeaver — implementing DBMS_DEBUG or DBMS_DEBUG_JDWP is genuinely hard. It requires managing two concurrent database sessions, handling asynchronous synchronization, parsing Oracle's backtrace format, and dealing with edge cases around package compilation, anonymous blocks, and exception handling. It took us significant engineering effort to get right, including hardening passes for timeout handling, connection cleanup, and source caching to prevent leaked connections.
But the result is that if you use DBeaver for Oracle development, you don't have step-through debugging. And you won't for the foreseeable future.
What About SQL Developer?
Oracle SQL Developer is free and cross-platform. It has a debugger. So why would anyone use anything else?
Performance. SQL Developer is a Java Swing application, and its startup time and UI responsiveness are frequent complaints. Oracle Community forums have threads with titles like "SQL Developer is EXTREMELY SLOW" going back years. On high-DPI displays, the UI scales poorly. Context switching between the debugger, editor, and results panels feels sluggish compared to native applications.
Oracle seems to agree that Swing has run its course. In January 2024 they launched Oracle SQL Developer for VS Code — a modern extension that added PL/SQL debugging in October 2024. It's a promising direction, but it uses JDWP exclusively, meaning you need the full reverse-connection and ACL setup. For environments where that infrastructure isn't available (corporate networks, cloud databases without direct connectivity), it's not an option.
DataGrip: Great Tool, Deprecated Protocol
DataGrip from JetBrains (now free for non-commercial use since October 2025) does support PL/SQL debugging cross-platform. Like Jam SQL Studio, it uses DBMS_DEBUG rather than JDWP.
The catch: JetBrains has acknowledged that DBMS_DEBUG is deprecated. They mentioned plans to add JDWP support around 2020, but the current status is unclear. For now, DataGrip's debugger works well, but at $299/year for commercial use, it's a significant investment — especially when Oracle is a secondary focus for a tool that supports dozens of database engines.
The DBMS_DEBUG Deprecation Question
Let's address the elephant in the room: DBMS_DEBUG has been deprecated since Oracle 12.2. Should you be worried?
"Deprecated" in Oracle's world doesn't mean "removed." Oracle has a careful distinction between deprecated (still works, but may be removed in a future version) and desupported (actually removed). DBMS_DEBUG is deprecated but NOT desupported. It works in Oracle 19c, 21c, 23ai, and the latest 26ai. No concrete removal timeline has been announced.
For context, Oracle deprecated the LONG datatype in Oracle 8i (1998). It still works in 26ai, nearly 30 years later. Oracle moves slowly on removals because enterprise customers depend on these APIs.
The practical reality: DBMS_DEBUG works today and will likely work for years. When (if) Oracle removes it, the industry will need to migrate to JDWP — and Jam SQL Studio will adapt. But we won't force users to set up firewall rules and ACL configuration until it's actually necessary.
Toad's Mac Arrival — and Its Price Tag
Quest Software launched Toad for Oracle on Mac in 2025 R1. This is significant — Toad has been the gold standard for Oracle development for over 20 years, and it was always Windows-only.
But Toad's pricing hasn't changed for the Mac version. The Base AI edition starts at ~$928/year. Professional AI is ~$1,388/year. Pro DB Admin AI is ~$2,179/year. For enterprise Oracle shops with dedicated budgets, that's fine. For individual developers, small teams, or organizations evaluating Oracle tools, it's a hard sell — especially when the same debugging capability is available for free in Jam SQL Studio.
There's also no Linux version. Toad for Mac covers macOS, but Linux developers are still left out.
What We Built — And What's Coming
Jam SQL Studio's PL/SQL debugger covers the complete debugging workflow that Oracle developers need day-to-day. But we're watching the ecosystem and have a clear view of where to go next.
What's shipping today:
- Breakpoints, stepping, variable inspection, call stack, watch expressions
- Exception breakpoints (break on all or specific exceptions)
- Anonymous block debugging from the query editor
- Package body, procedure, function, and trigger debugging
- One-click "Compile for Debug" with compilation status badges
- Resizable panels and keyboard shortcuts (F5/F10/F11)
- No Oracle Client required — Thin mode driver, no JDWP infrastructure
On the roadmap:
- Conditional breakpoints — break only when an expression evaluates to true, or after N passes (essential for debugging loops)
- Variable modification — edit variable values mid-debug to test different scenarios without changing code
- Remote session debugging — attach to an already-running session to debug PL/SQL triggered by application calls
- DBMS_DEBUG_JDWP support — for environments that require the modern protocol, with guided ACL/firewall setup
- PL/SQL profiling — DBMS_PROFILER integration for performance analysis beyond step-through debugging
Getting Started
If you're already using Jam SQL Studio with an Oracle connection, open any package in the Package Browser and click "Debug" in the toolbar. Or right-click a procedure in the Object Explorer.
If you're new to Jam SQL Studio:
- Download for your platform (Mac, Windows, or Linux)
- Connect to your Oracle database (12.2+) — no Oracle Client needed
- Ensure your user has
DEBUG CONNECT SESSIONandDEBUG ANY PROCEDUREprivileges - Right-click a procedure or package and select "Debug"
The full walkthrough is in the PL/SQL Debugger documentation.
Debug PL/SQL on Any Platform
Jam SQL Studio brings step-through PL/SQL debugging to Mac, Windows, and Linux. No Oracle Client required. Free for personal use.