Last updated: 2026-04-29
Data Profiling
Get a quick read on any column without writing aggregation SQL. Distribution histograms, quartiles, distinct counts, and top frequent values — at the speed of a popover, or as a deep workspace tab.
Two Ways to Profile
Data profiling is built into the places you already work with data: results grids, the Table Explorer, and the Object Explorer. Both experiences share the same set of statistics.
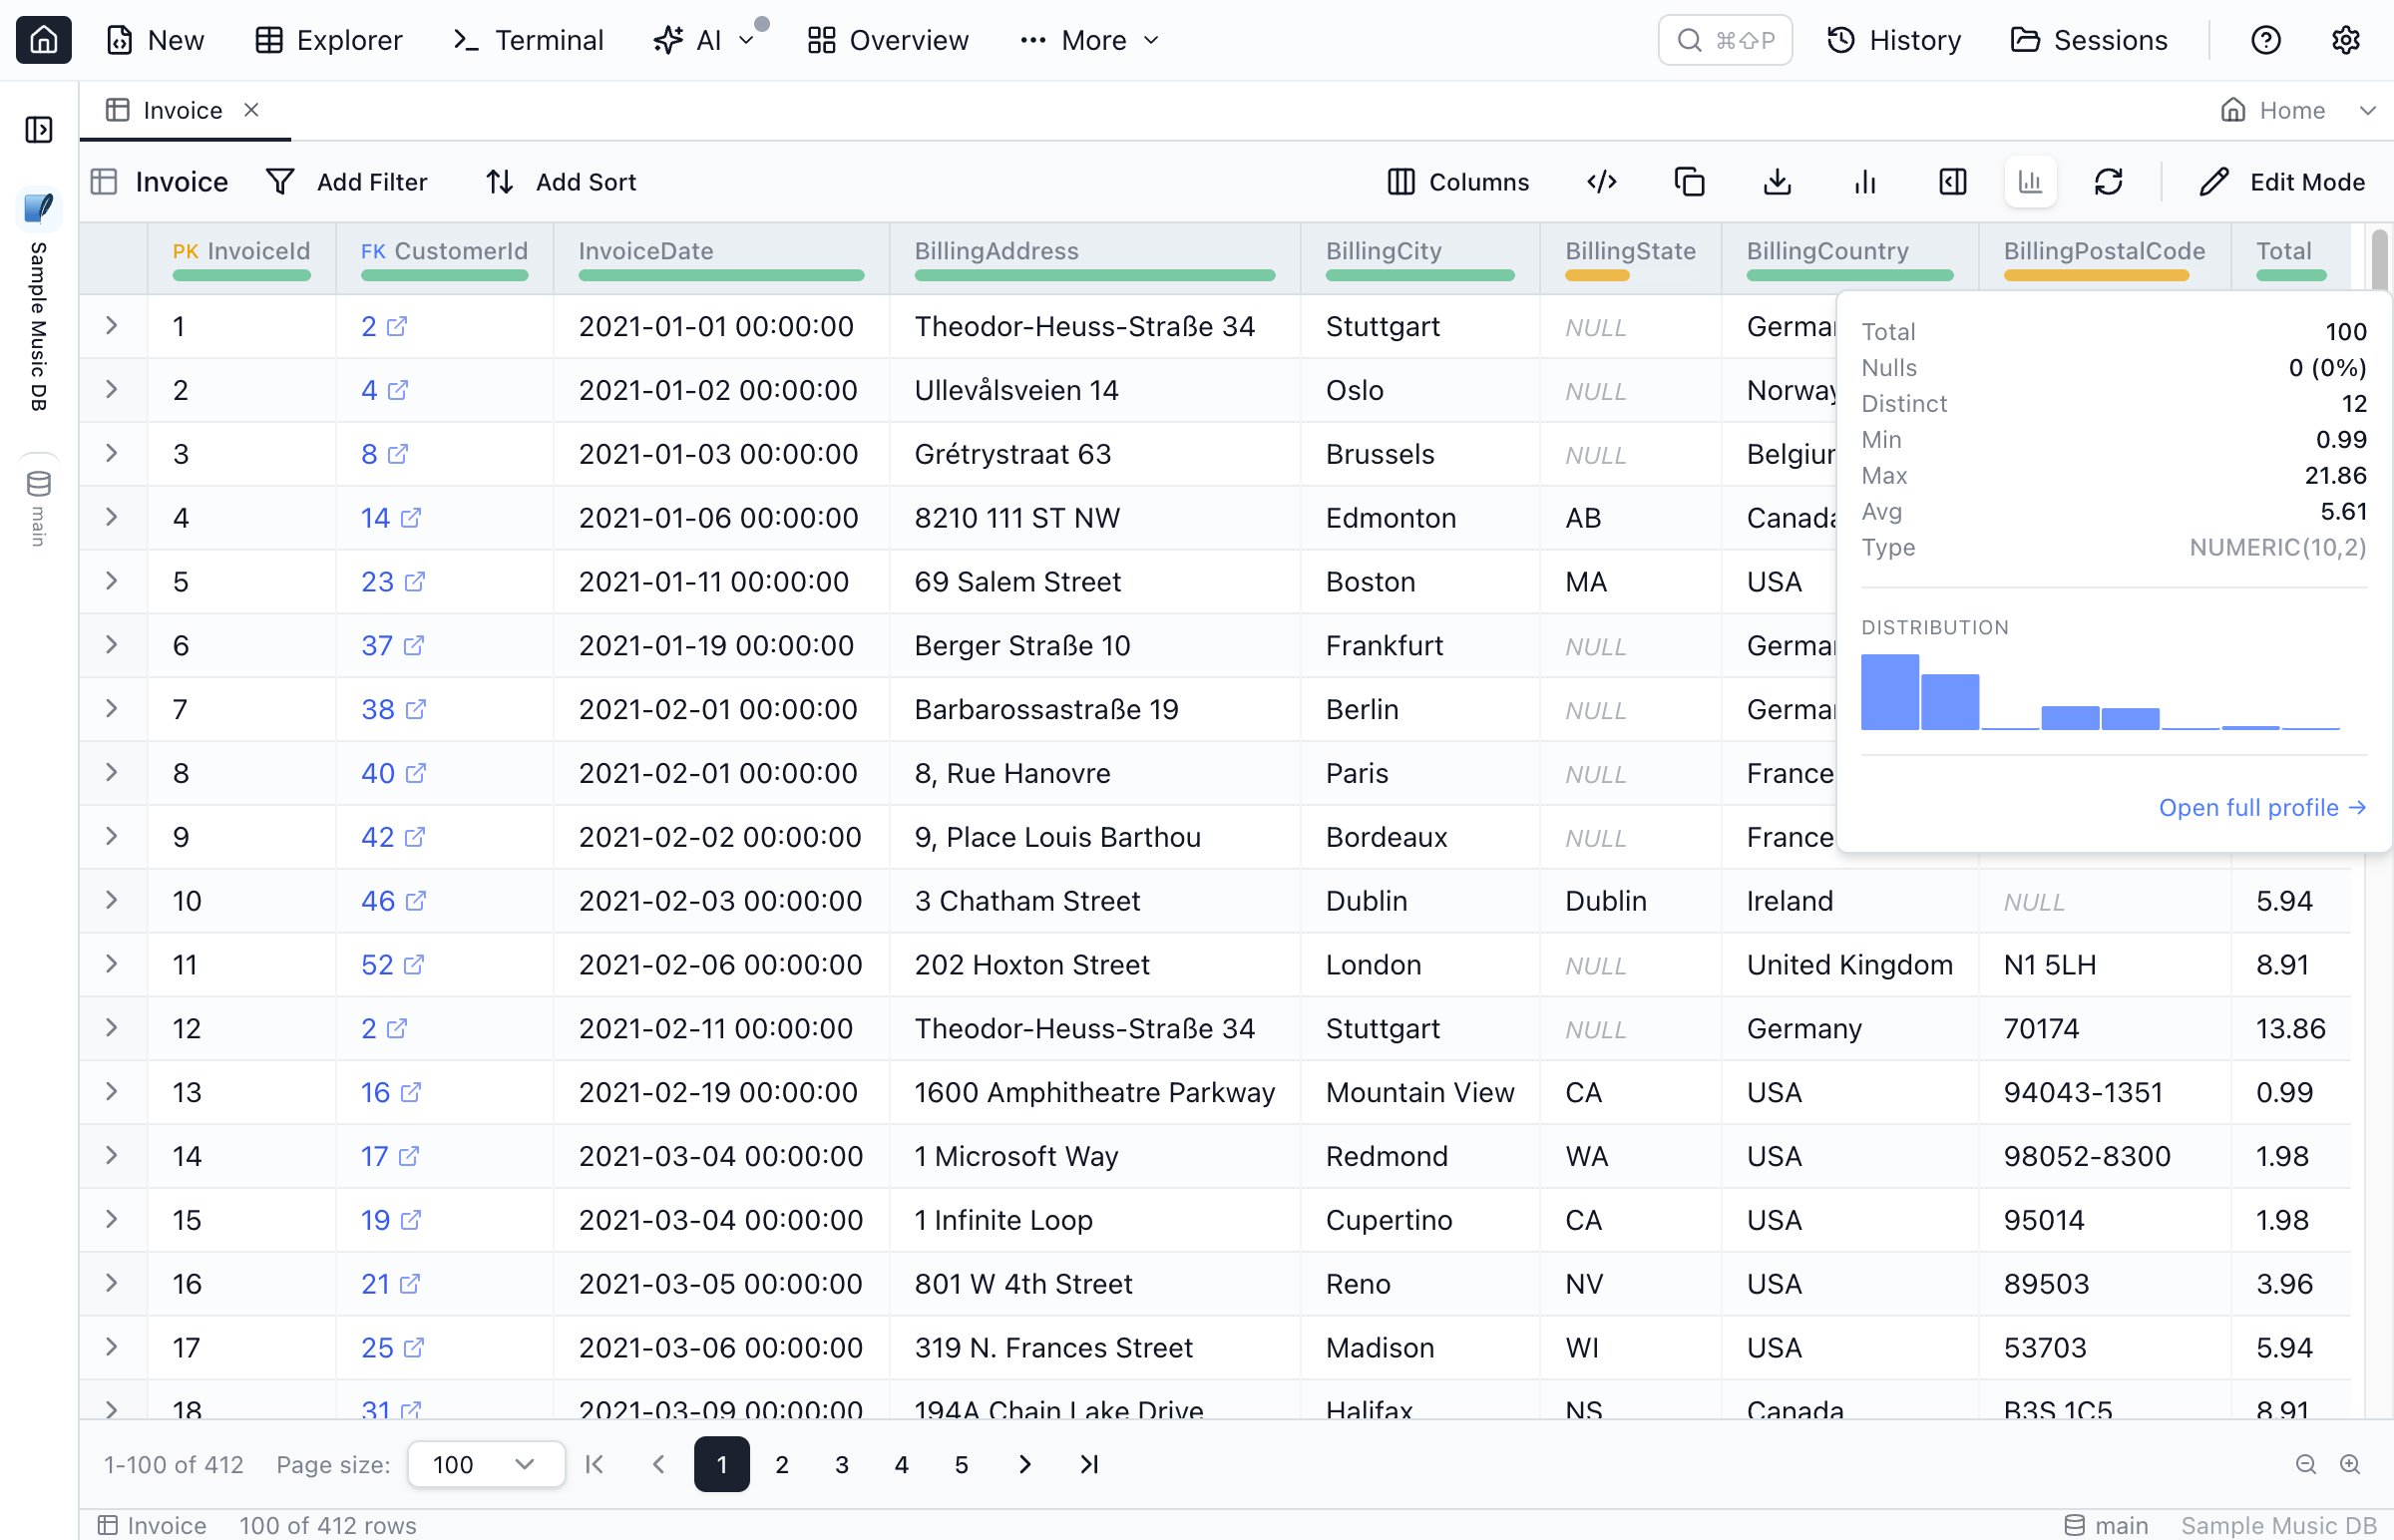
1. Inline Popover
A small badge appears under each column header in the results grid and Table Explorer when profiling is enabled. Click the badge to open a compact popover with the column's summary, mini histogram, and top values.
- Toggle the badges in the Table Explorer toolbar to keep the grid clean when you don't need profiling.
- The popover renders from the rows currently loaded in the grid — instant, but bounded by what you've fetched.
- Use Open full profile → at the bottom of the popover to switch to the workspace view.
2. Workspace Tab (Profile Data)
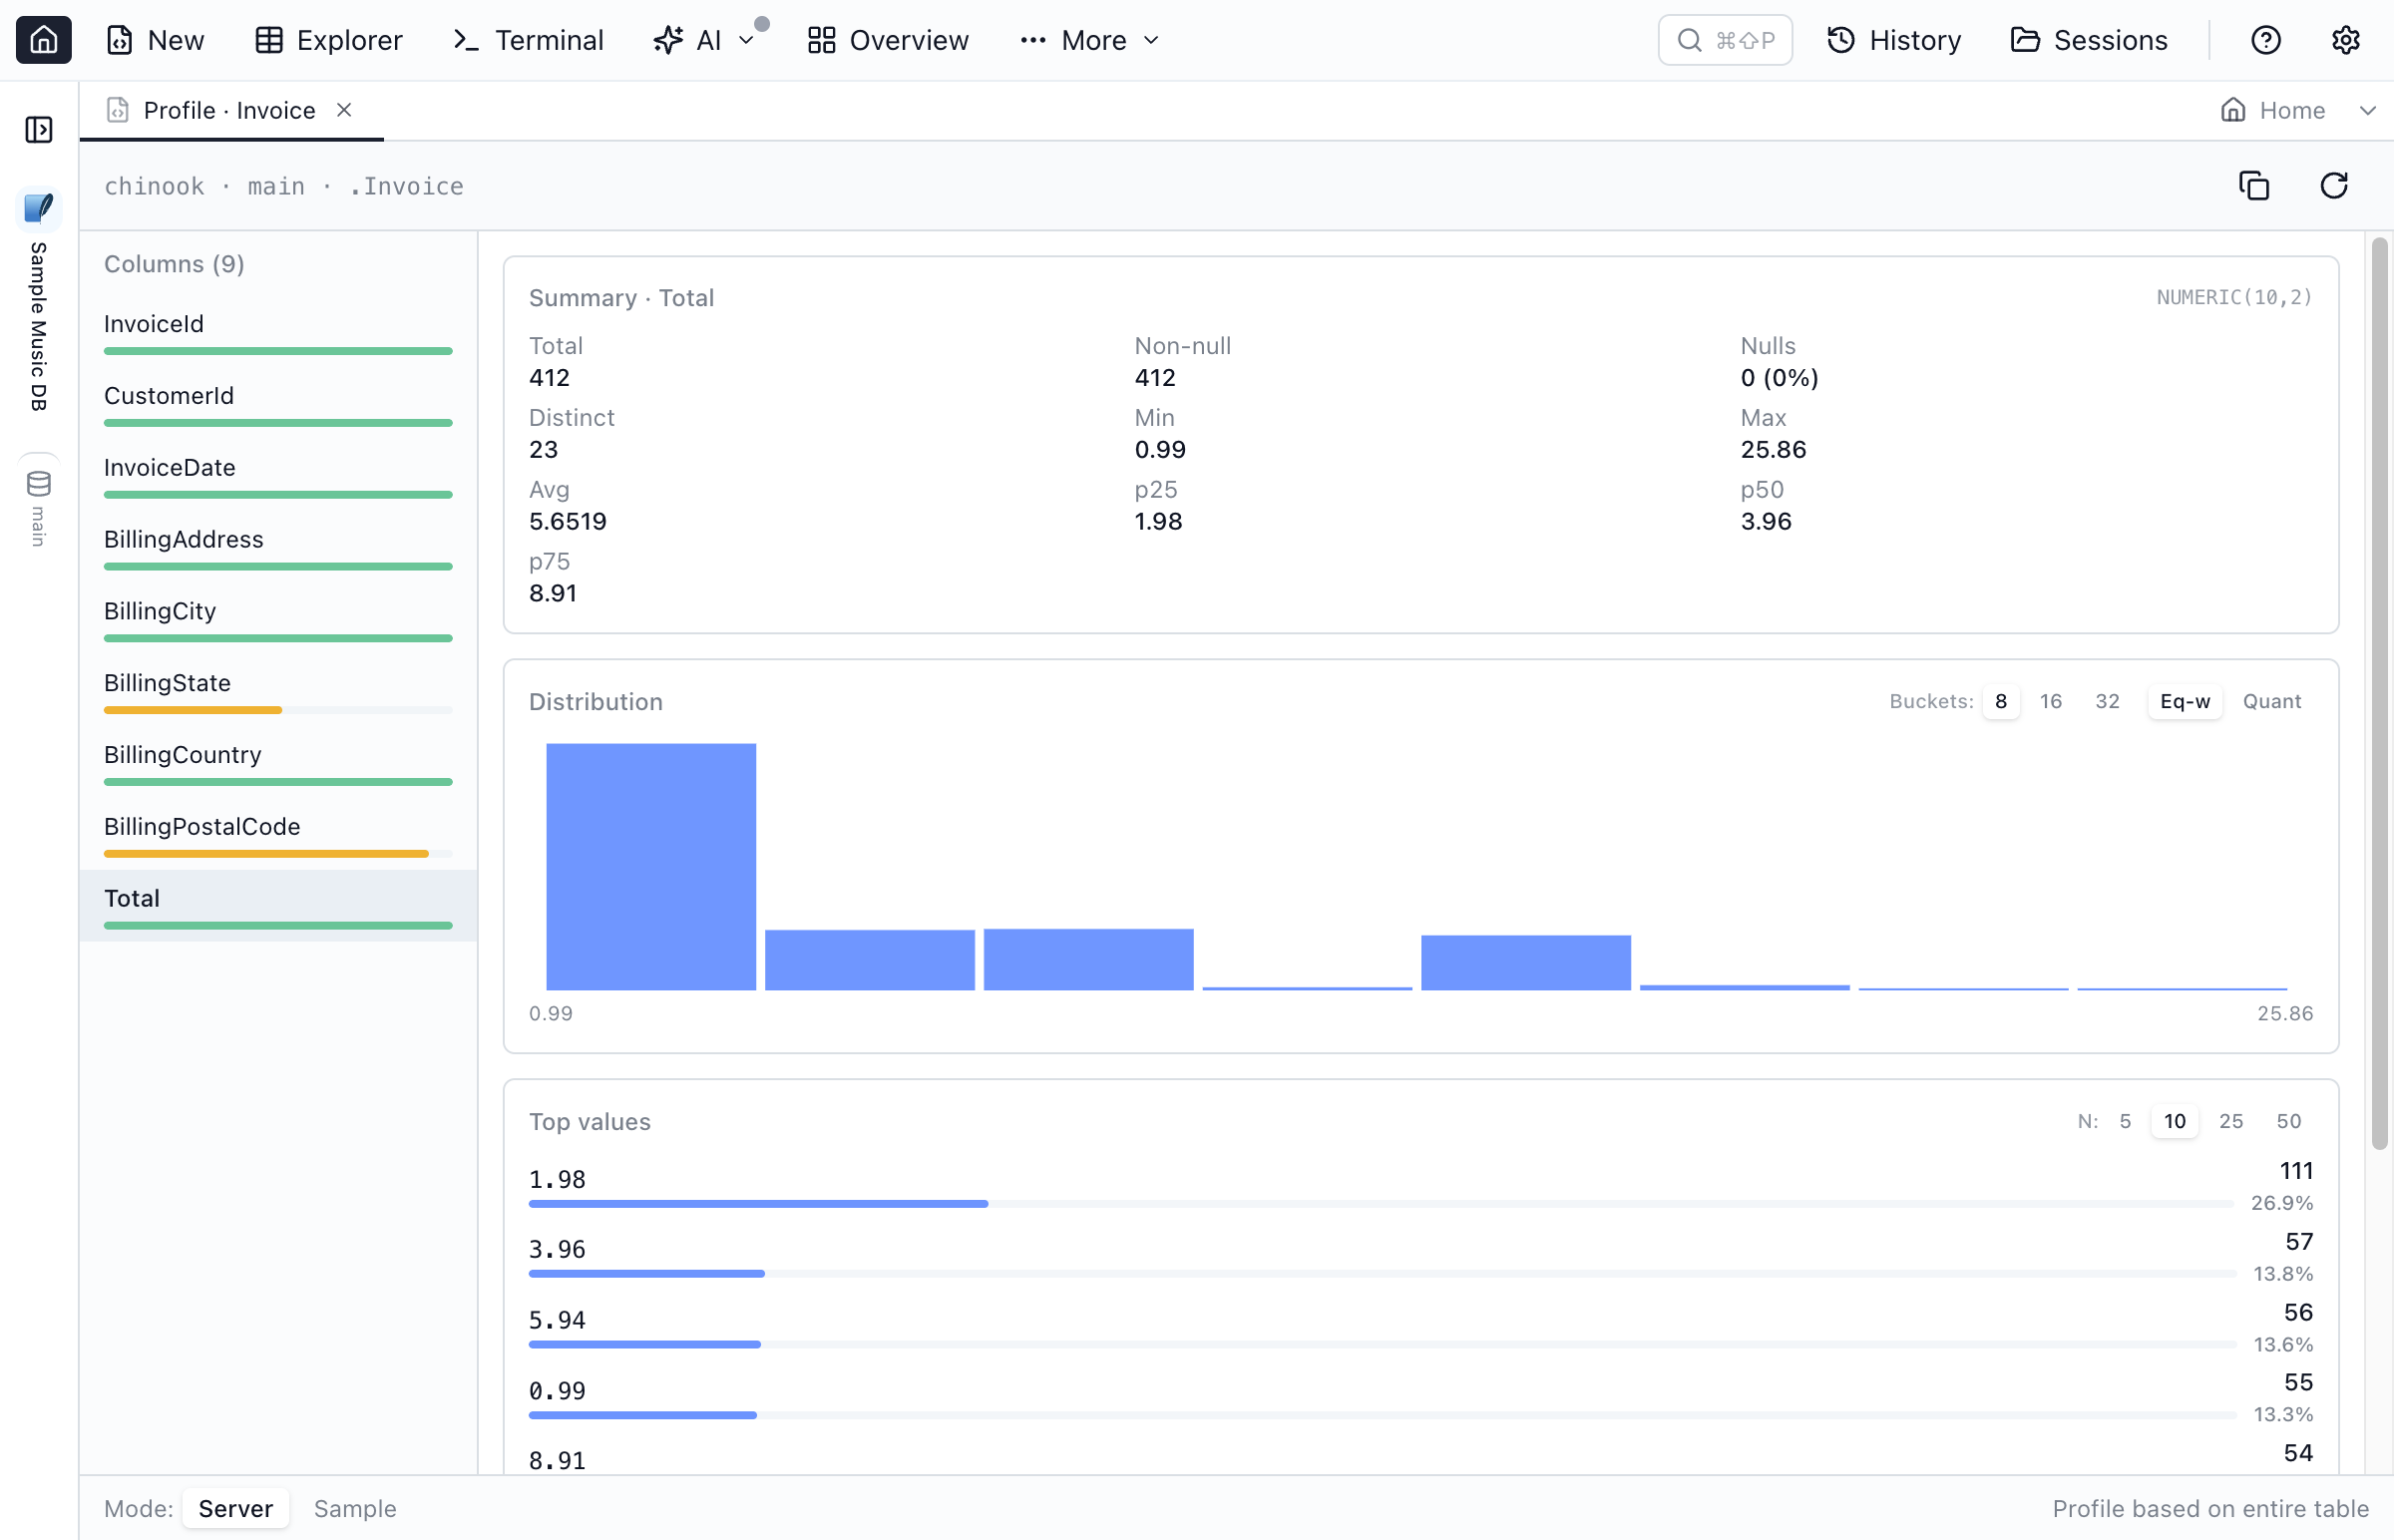
Right-click any table or column in the Object Explorer and choose Profile data. A dedicated workspace tab opens with the full layout: column list on the left, summary + histogram + top values on the right, and a footer that controls the data source and scope.
Summary Statistics
For every column, the profile reports:
- Total / Non-null / Nulls with null percent
- Distinct count (capped at 10,000 in summary mode)
- Min / Max / Avg for numeric and date columns
- p25 / p50 / p75 quartiles for numeric columns
- Detected data type
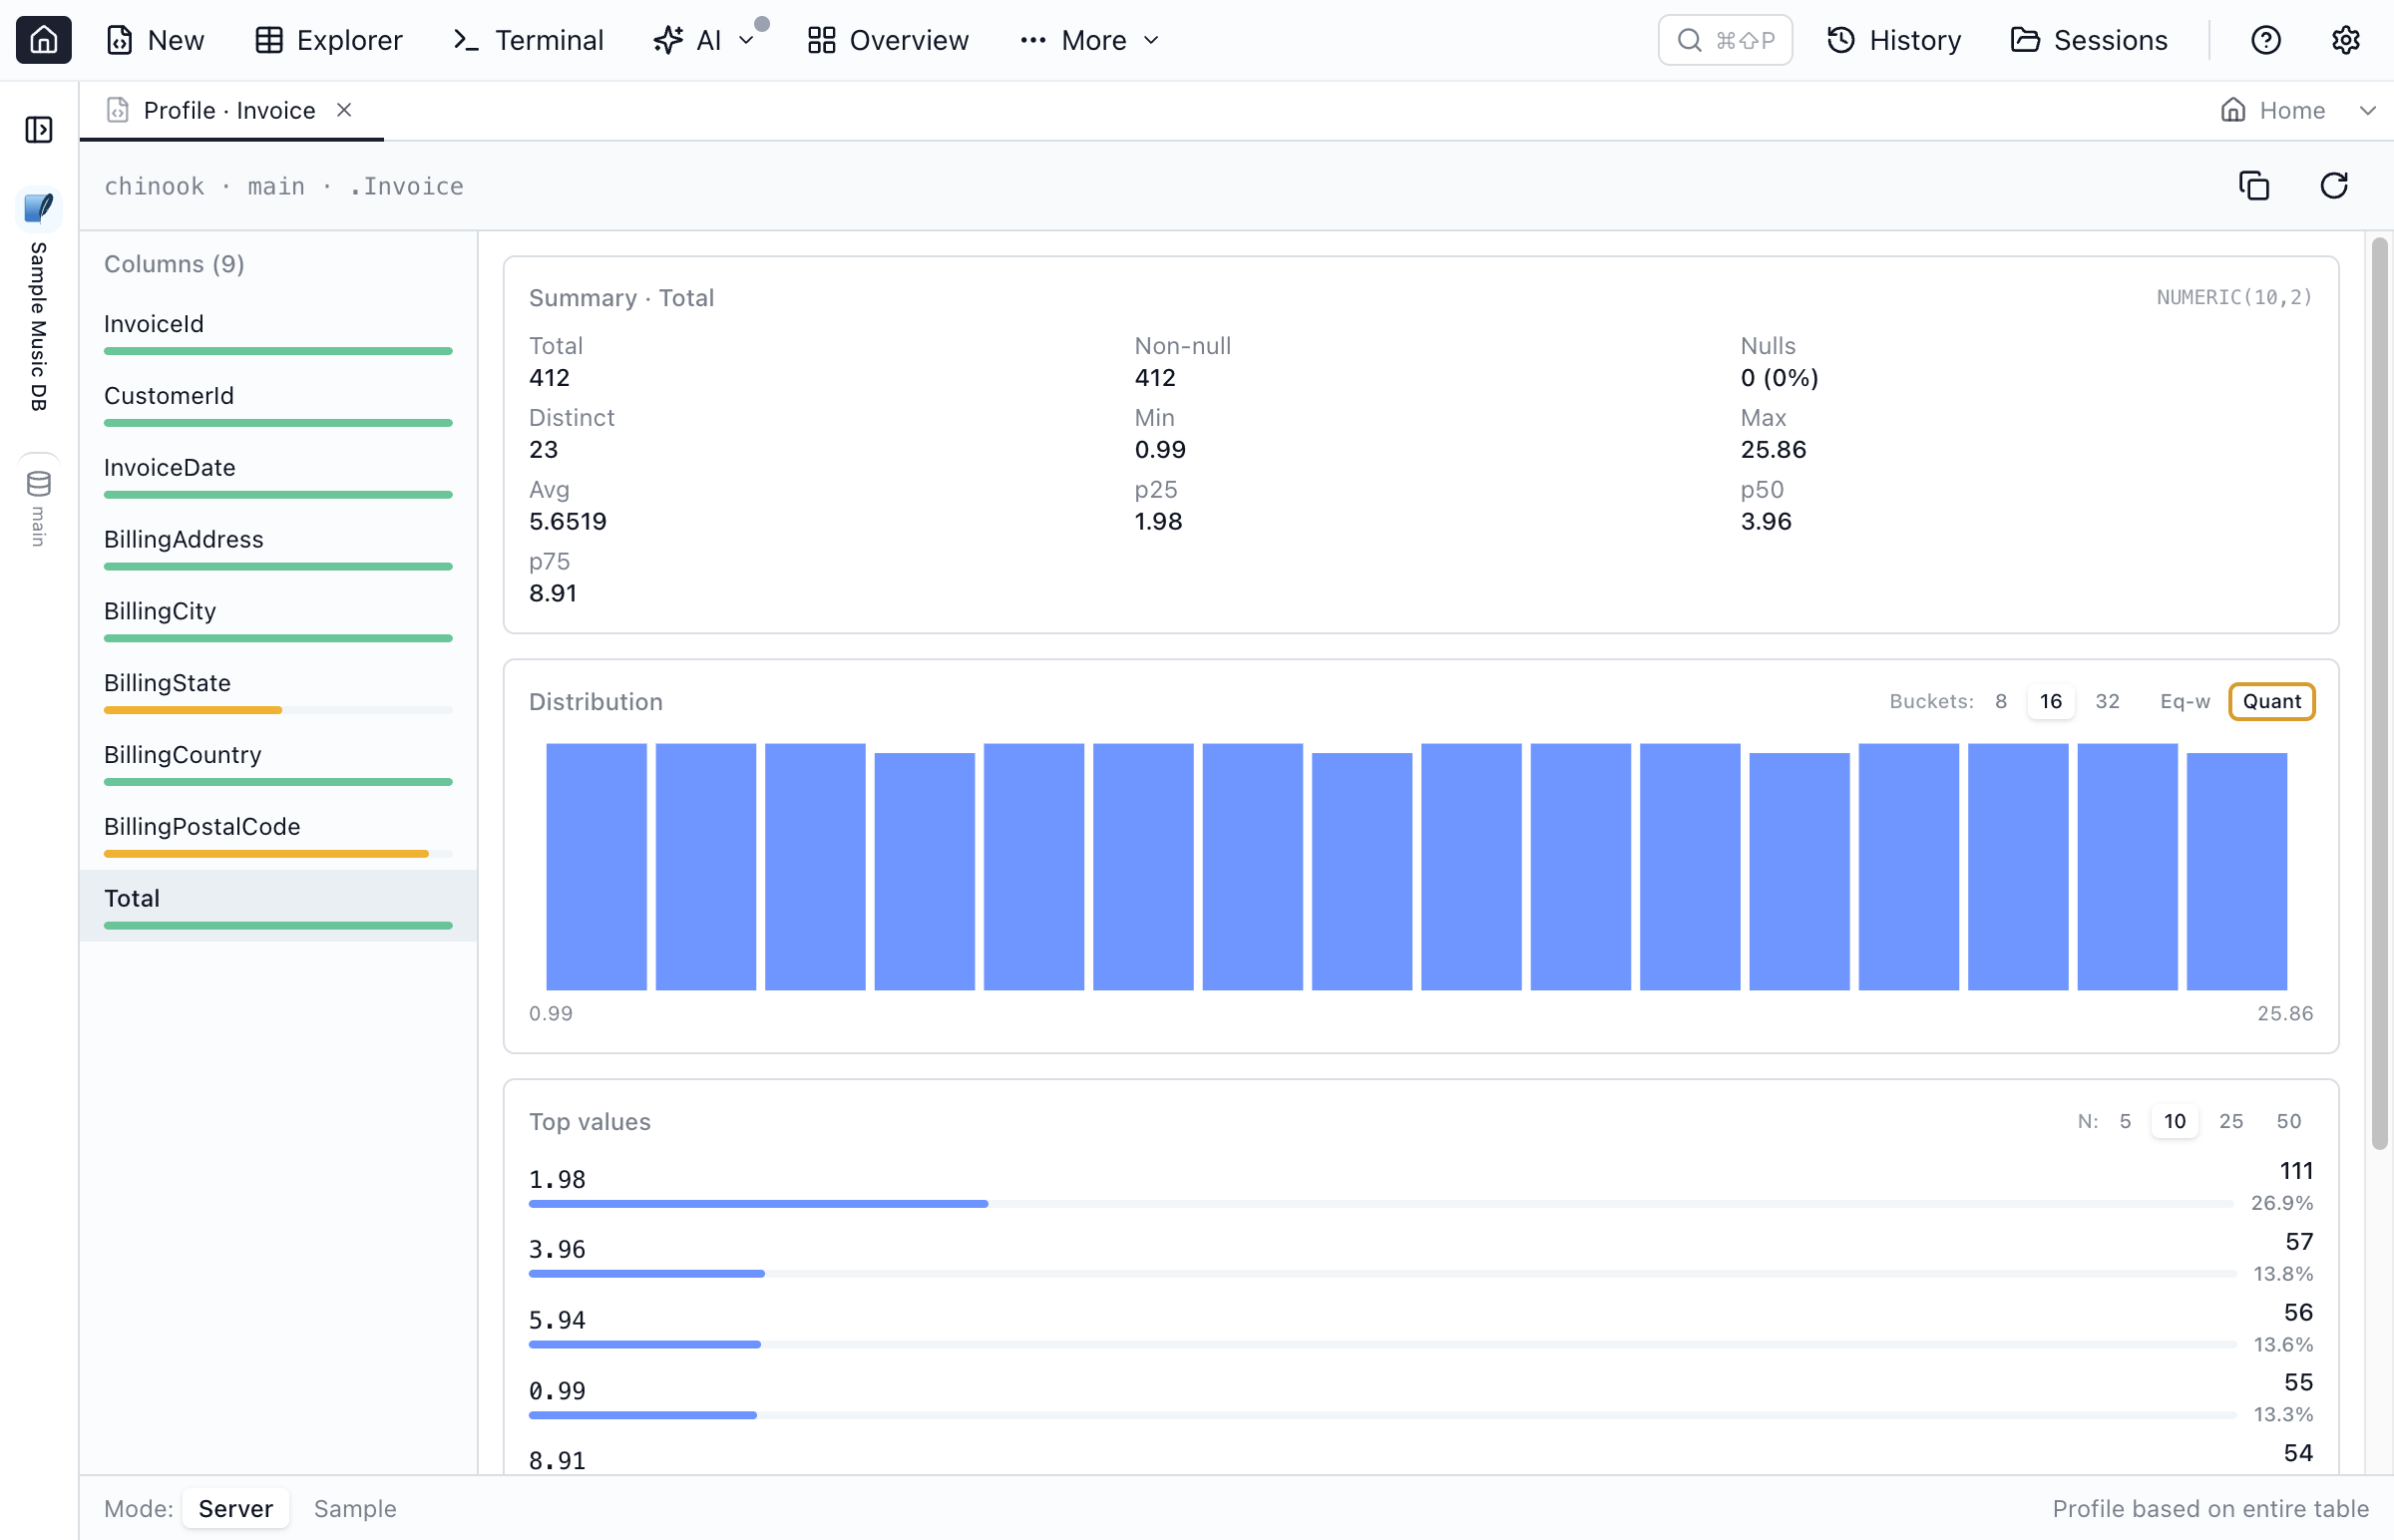
Histograms
The histogram card shows the distribution of a numeric column.
- Bucket count: 8 (default), 16, or 32 buckets.
- Equal-width: bucket boundaries are evenly spaced between min and max.
- Quantile: bucket boundaries follow the data distribution (every bucket has roughly the same count). Useful for skewed columns.
Top Values
The top values card lists the most common values for the focused column. Choose 5, 10, 25, or 50 entries.
Server Mode vs Sample Mode
The footer mode toggle decides where the numbers come from.
| Mode | How it works | When to use |
|---|---|---|
| Server | Per-engine aggregation SQL runs against the live table (or a filtered subset). Distinct counts, percentiles, histograms — all computed by the database. | Accuracy on whole tables. Default mode when opening from the Object Explorer. |
| Sample | A bounded batch of rows is fetched once, then all stats are derived in-memory. | Quick exploration. Approximate but instant — useful for huge tables or when iterating on a column. |
Switch modes from the footer. The scope text on the right of the footer always reflects what you're looking at: "Profile based on entire table", "first 10,000 rows", or with a filter applied.
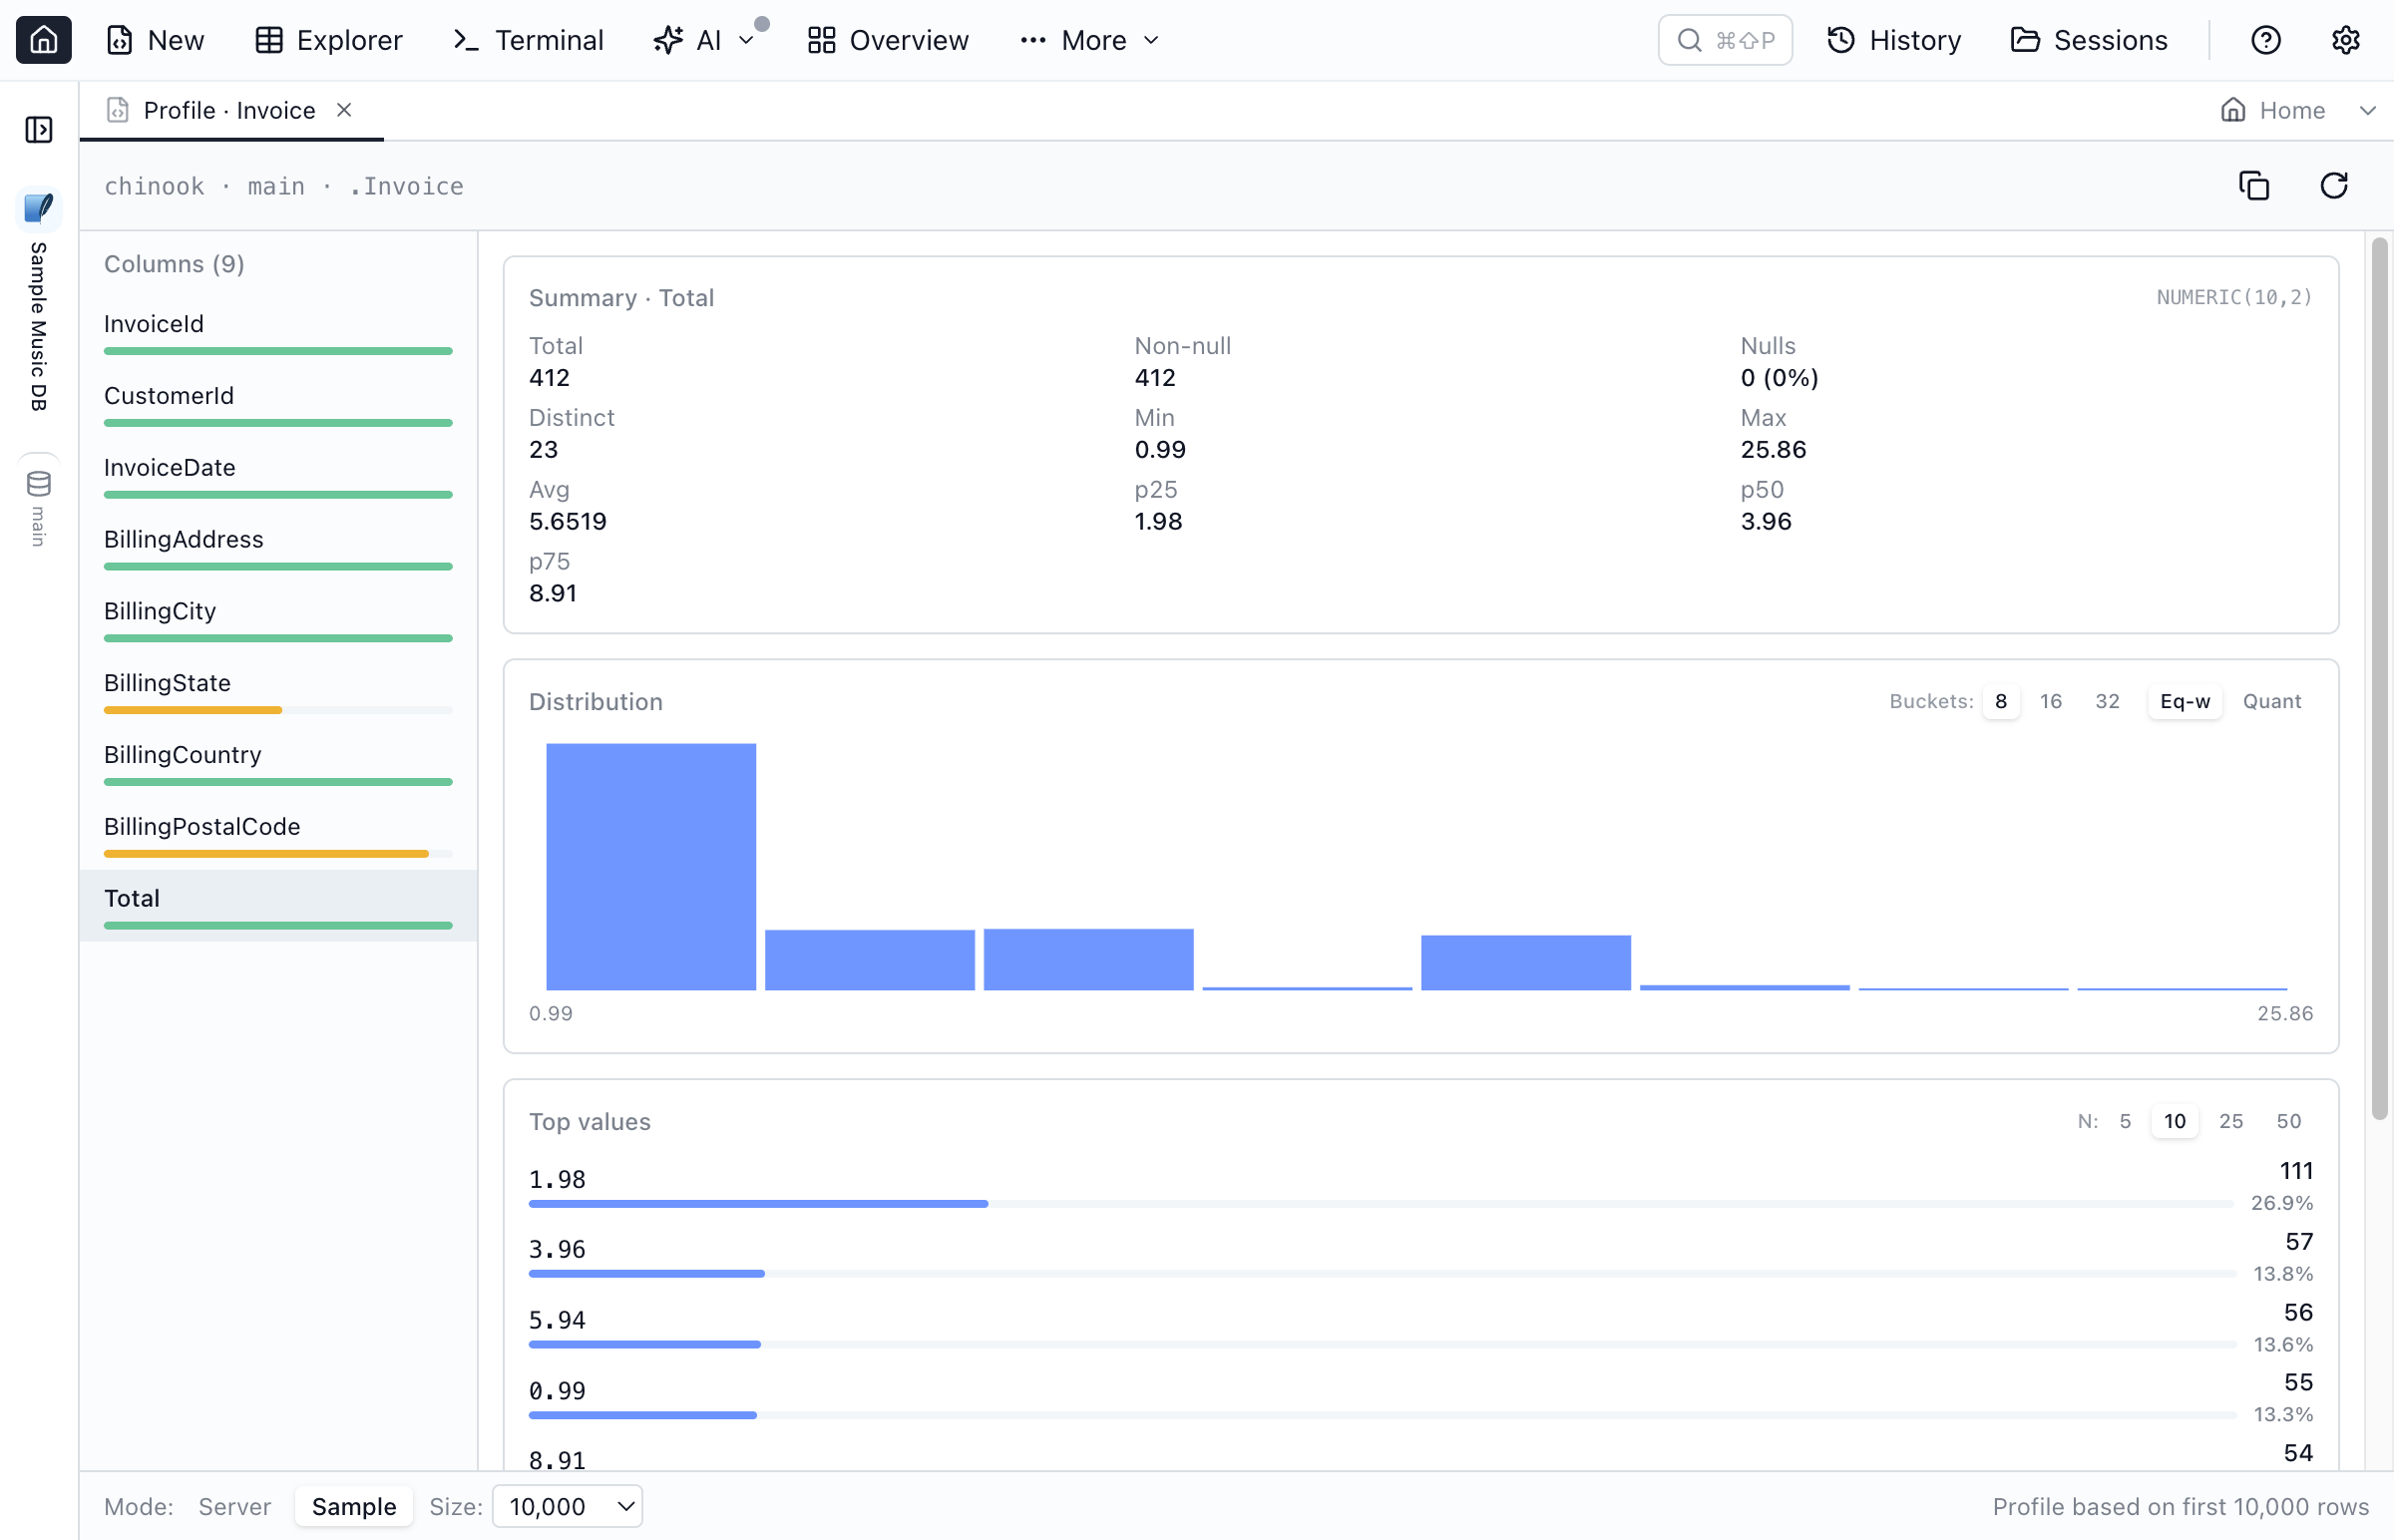
Profiling Big Tables
When a table is large, profiling the whole thing can be slow. Two ways to scope down:
- Switch to Sample mode and pick a sample size (1,000 / 5,000 / 10,000 / 50,000 / 100,000 rows).
- Apply a filter in the Table Explorer (WHERE clause + row cap) — when you click Profile data, that filter is carried into the profile tab automatically.
Copy to Markdown
The header of the profile tab has a copy-to-markdown button. It writes a clean markdown block — column summary, histogram bins, and top values — straight to the clipboard. Paste it into PR descriptions, tickets, design docs, or AI chat.
Per-Engine Behavior
| Engine | Quartiles | Quantile histogram | Equal-width histogram |
|---|---|---|---|
| SQL Server | PERCENTILE_CONT | NTILE | WIDTH_BUCKET fallback |
| PostgreSQL | PERCENTILE_CONT | NTILE | WIDTH_BUCKET |
| Oracle | PERCENTILE_CONT | NTILE | WIDTH_BUCKET |
| MySQL | ROW_NUMBER fallback | ROW_NUMBER fallback | CASE expression |
| SQLite | ROW_NUMBER fallback | ROW_NUMBER fallback | CASE expression |
Frequently asked questions
How do I profile a column in Jam SQL Studio?
Click the small badge under any column header in the results grid or Table Explorer. A popover opens with summary stats, a histogram, and the most frequent values. For a deeper view, right-click a column or table in the Object Explorer and choose Profile data — that opens a dedicated workspace tab.
What is the difference between Server mode and Sample mode?
Server mode runs aggregation queries against the full table (or a filtered subset) and returns exact statistics. Sample mode fetches a small batch of rows and computes the stats in-memory — much faster and useful for quick exploration, but only based on the rows you fetched.
Which databases are supported?
Server-mode profiling works on SQL Server, PostgreSQL, MySQL, Oracle, and SQLite. Per-engine SQL is generated automatically — Postgres and Oracle use NTILE/PERCENTILE_CONT/WIDTH_BUCKET natively, MySQL/SQLite use ROW_NUMBER() math fallbacks.
Can I profile a filtered subset of a large table?
Yes. The data profile workspace honors the WHERE clause and row limit you set in the Table Explorer filter builder. Profiles update with the same scope, and the footer shows the active scope text.
Can I copy a profile into documentation or chat?
Yes. The data profile tab has a copy-to-markdown button in its header that writes a markdown table with summary stats, histogram, and top values to your clipboard — paste it into PRs, tickets, Slack, or LLM chat.
Profile Your First Column
Download Jam SQL Studio and explore your data with one click.