
Last updated: 2026-07-02
Schema Overview
See a whole database at a glance. Schema Overview draws tables, views, stored procedures, and functions as color-coded nodes on an interactive graph, connected by arrows for foreign keys, view references, and routine references — across SQL Server, PostgreSQL, MySQL/MariaDB, Oracle, and SQLite.
What is Schema Overview?
Schema Overview is a visual database diagram generated from live metadata. Instead of reading table lists in a tree, you get a map: every object is a node, and the relationships the database tracks — foreign keys between tables, the tables a view reads, the objects a routine references — are edges between them. It's a fast way to learn an unfamiliar schema, spot how tables connect, and produce a diagram for documentation.
Supported engines: SQL Server, PostgreSQL, MySQL/MariaDB, Oracle, and SQLite. Foreign-key edges are drawn for every engine; view-reference and routine-reference edges are collected for SQL Server, PostgreSQL, and MySQL. (In the in-browser demo, Schema Overview currently supports SQLite only.)
Opening Schema Overview
From the toolbar
- Click the Overview button in the main toolbar
- The schema graph loads for the active database
From the Object Explorer
- Right-click a database in the Object Explorer
- Choose Show Overview
- The database's schema opens in a new tab
From the Command Palette
Open the Command Palette (Cmd/Ctrl+Shift+P) and run Schema Overview to open it for the active database.
Understanding the graph
Schema Overview renders your database with React Flow, so it's a live, pannable, zoomable canvas rather than a static picture.
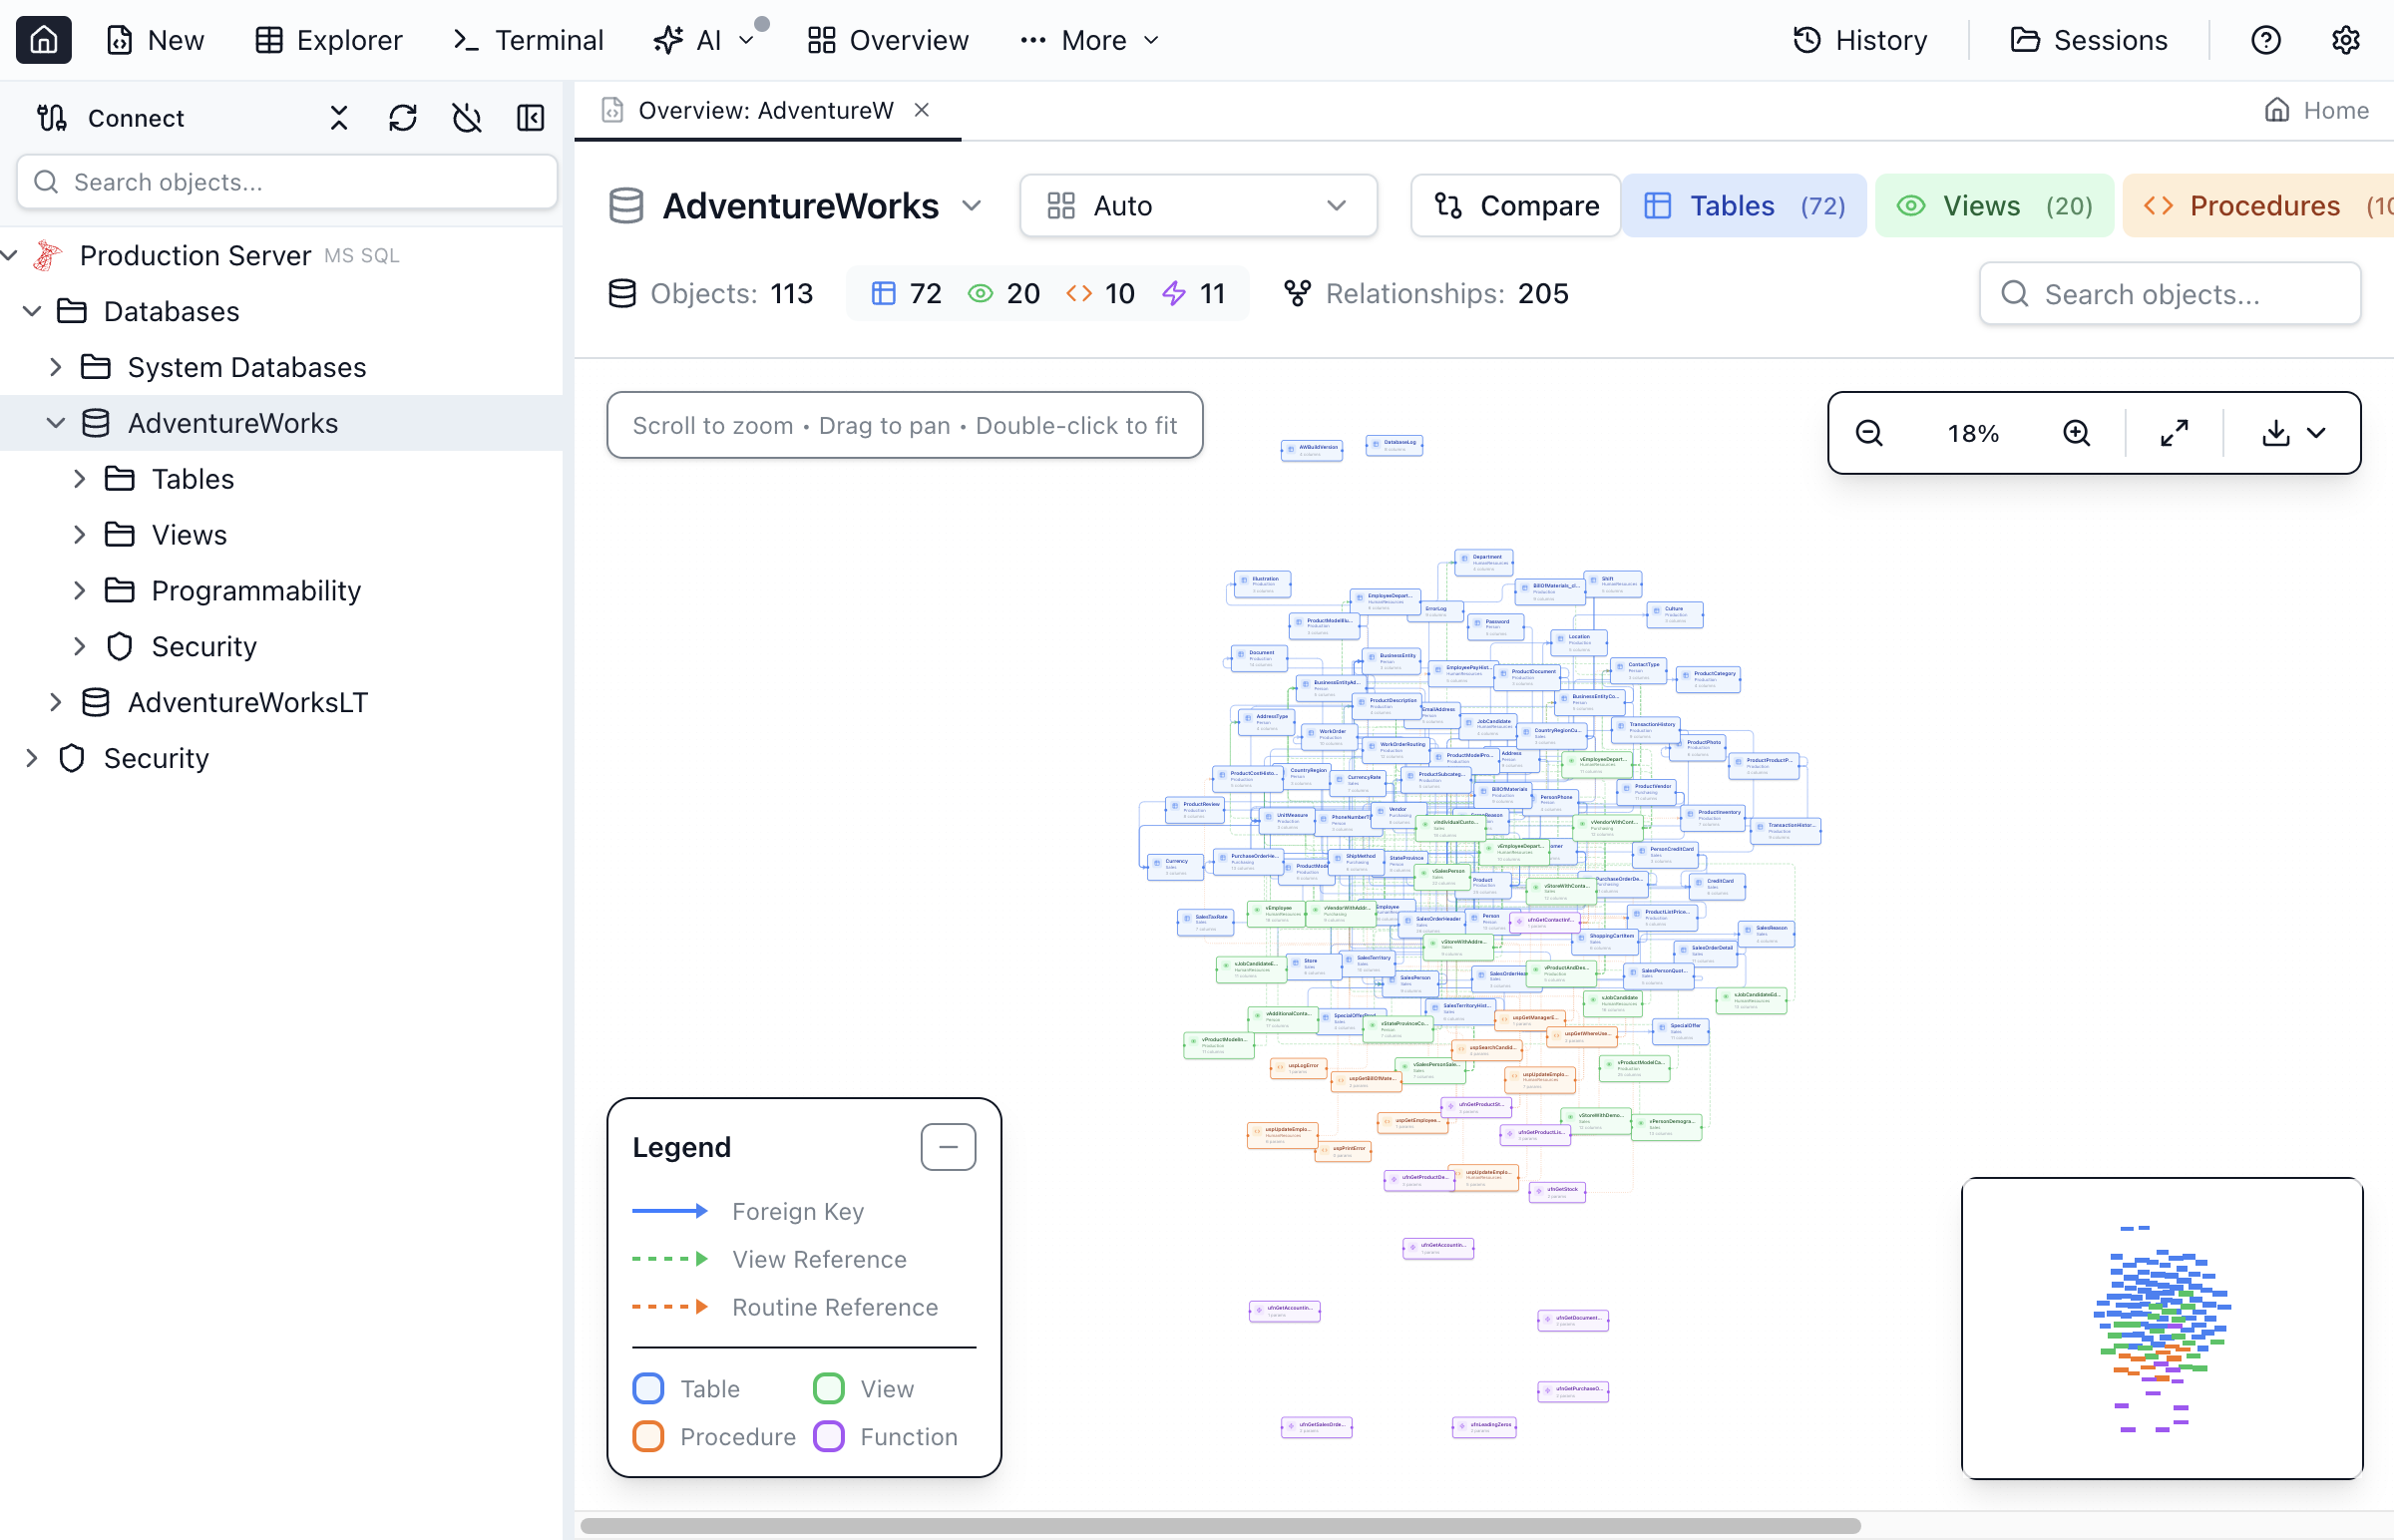
Node types and colors
| Object Type | Color | Node detail |
|---|---|---|
| Tables | Blue | Column count (e.g., "12 columns") |
| Views | Green | Column count |
| Stored Procedures | Orange | Parameter count (e.g., "3 params") |
| Functions | Purple | Parameter count |
Each node shows the object name, a schema prefix when it isn't the default (the prefix is hidden for dbo and public), a type icon, and — in Pro — an annotation badge when a note is attached.
Relationship arrows
Edges are color- and style-coded by relationship kind:
- Foreign key — solid blue arrow from the referencing (child) table to the referenced (parent) table
- View reference — dashed green, from a view to the tables it reads
- Routine reference — dotted orange, from a procedure or function to the objects it uses
- Loose relationship — dashed blue, for a user-declared loose foreign key that has no real database constraint
An on-canvas legend labels the Foreign Key, View Reference, and Routine Reference edge styles.
Navigating the graph
Pan and zoom
- Pan — drag empty canvas to move the view
- Zoom — scroll, or use the zoom in / out controls
- Reset zoom — jump back to 100%
- Fit to view — frame all nodes; double-clicking empty canvas also fits the view
- Minimap — a pannable, zoomable overview in the corner for large schemas
Selecting and opening objects
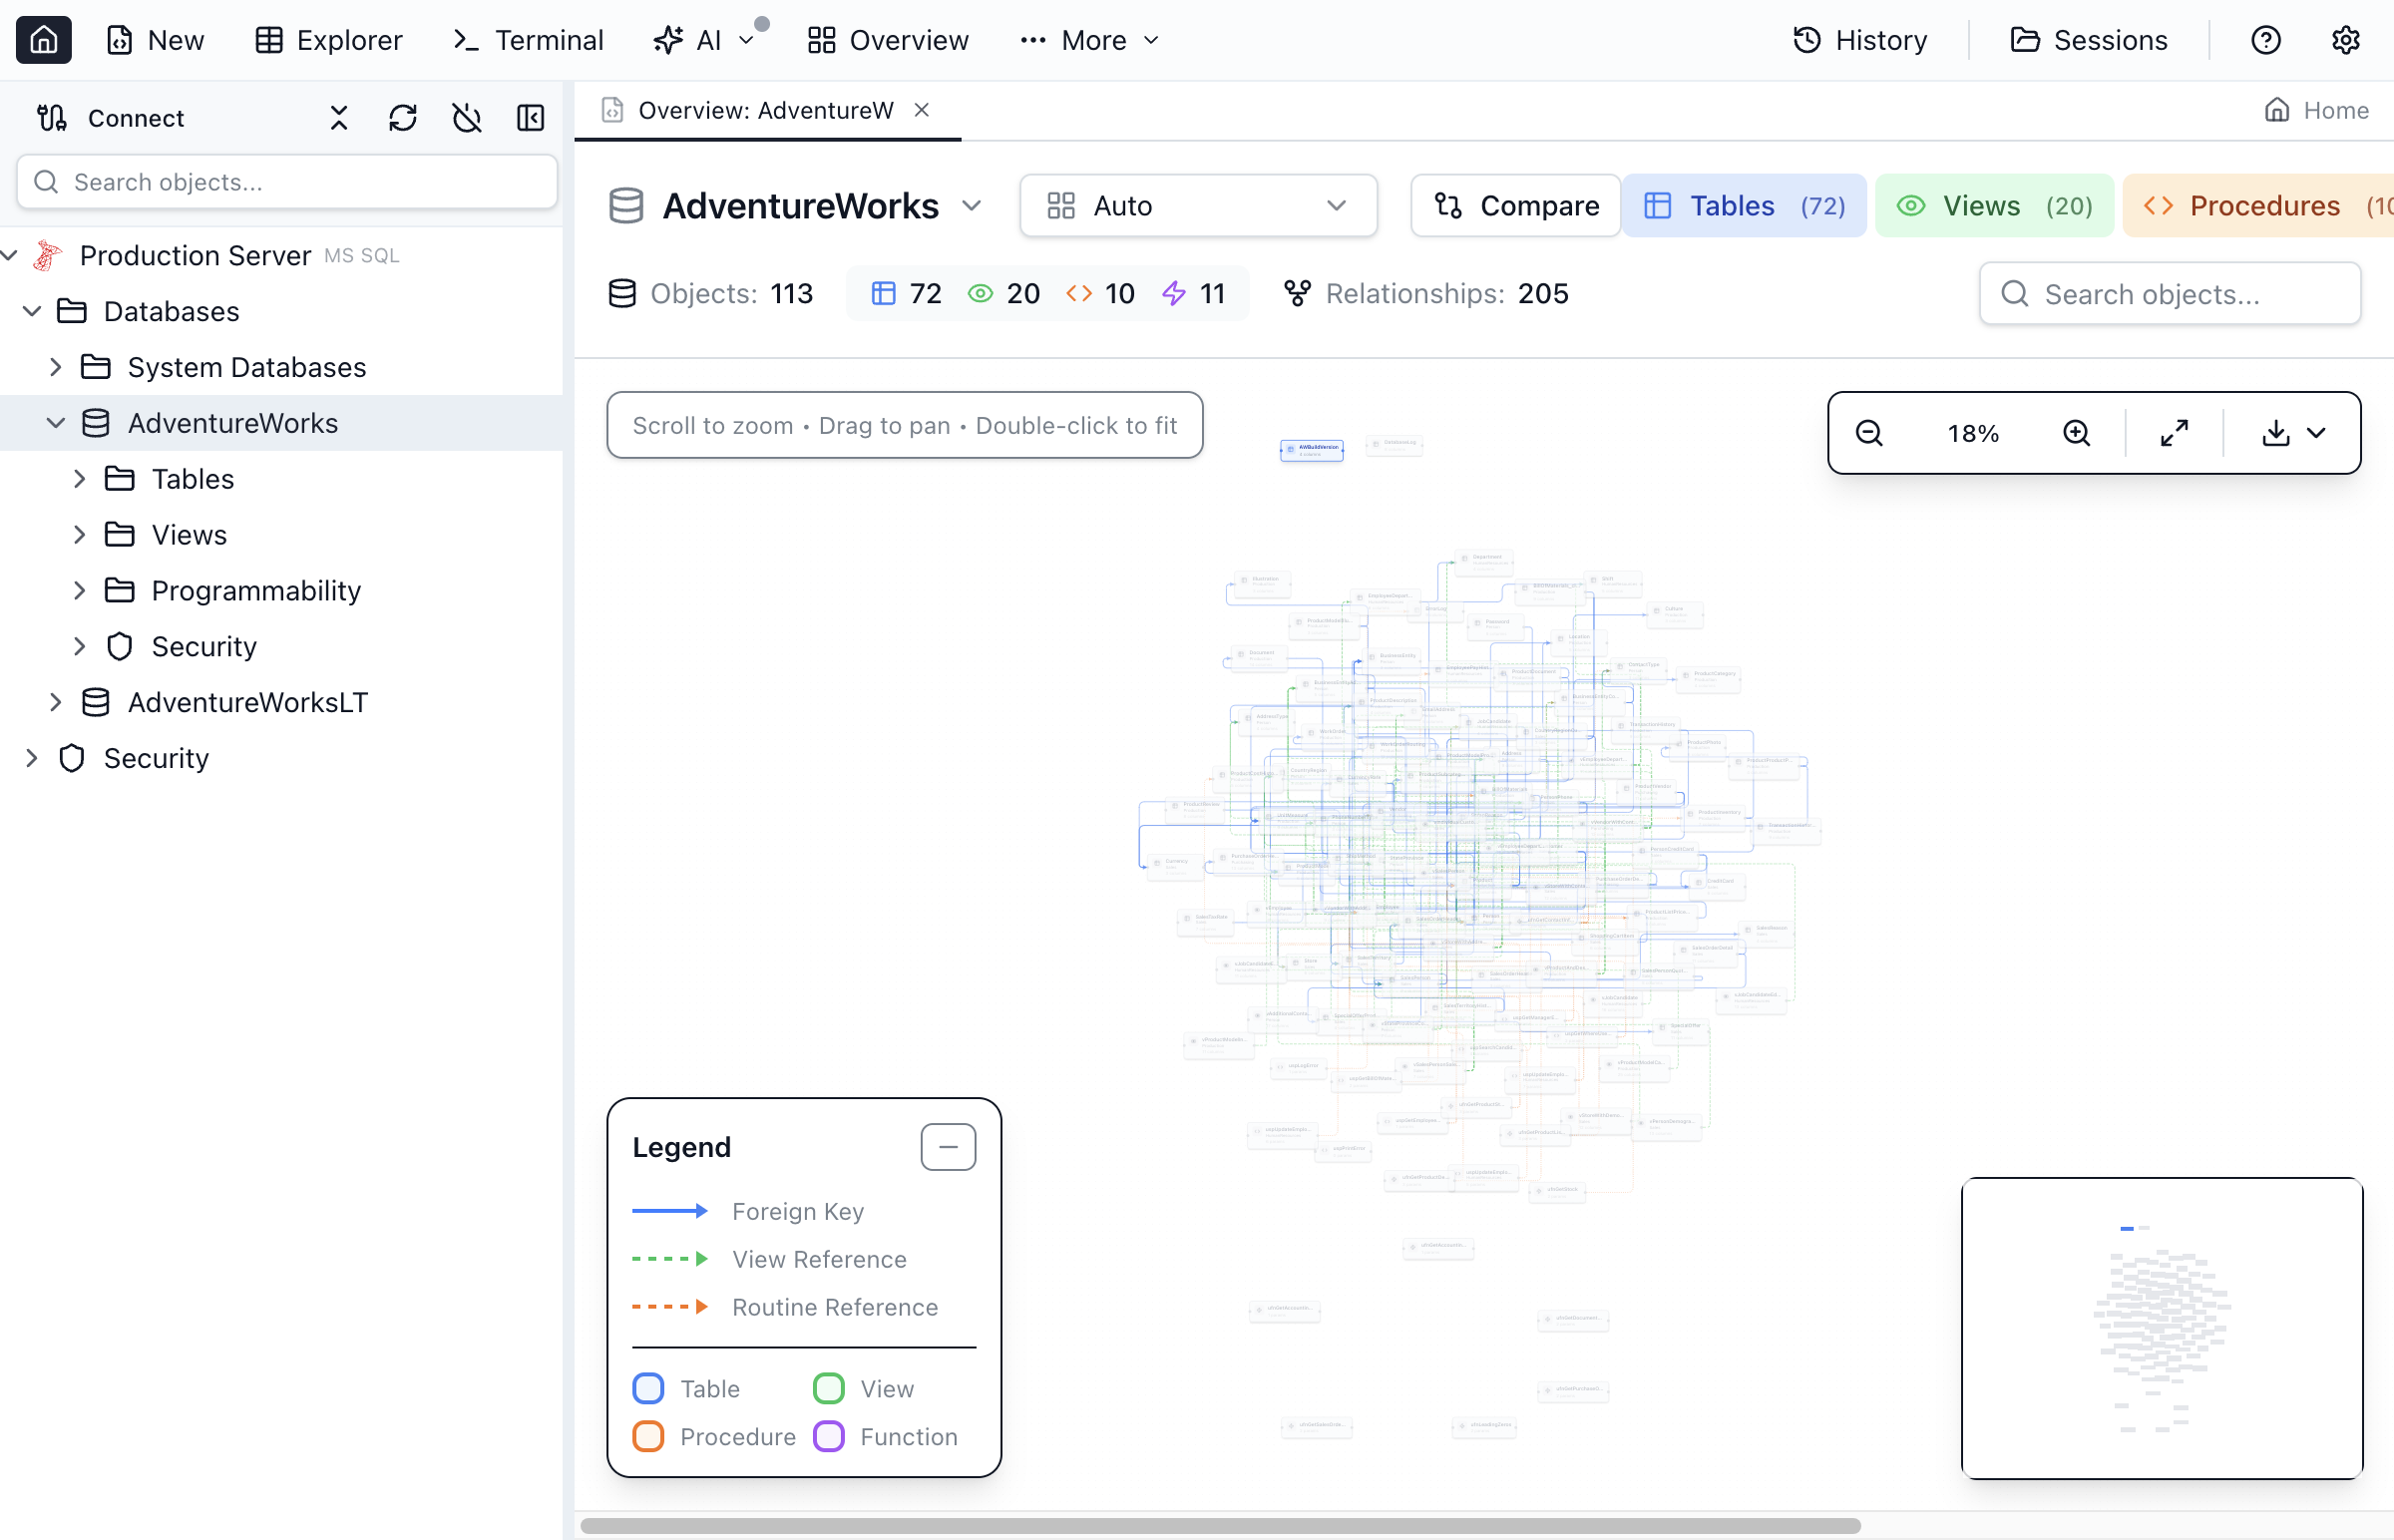
- Click a node to select it. Its connections stay highlighted while unconnected nodes dim, and an object details drawer opens.
- Right-click a node for its action menu (the same actions as the Object Explorer): Select Top / Edit Top rows (opens Table Explorer), Script as CREATE / ALTER / DROP (see Scripting), Execute, Design Table (opens the Table Designer), Dependencies, and Properties.
Layout algorithms
A layout selector controls how nodes are arranged:
- Auto — groups by object type with force adjustment (available to everyone)
- Hierarchical (Pro) — top-down by foreign-key direction
- Circular (Pro) — concentric circles by type
- Force-Directed (Pro) — physics-based positioning
Filtering and search
Large schemas get busy, so Schema Overview gives you two ways to focus.
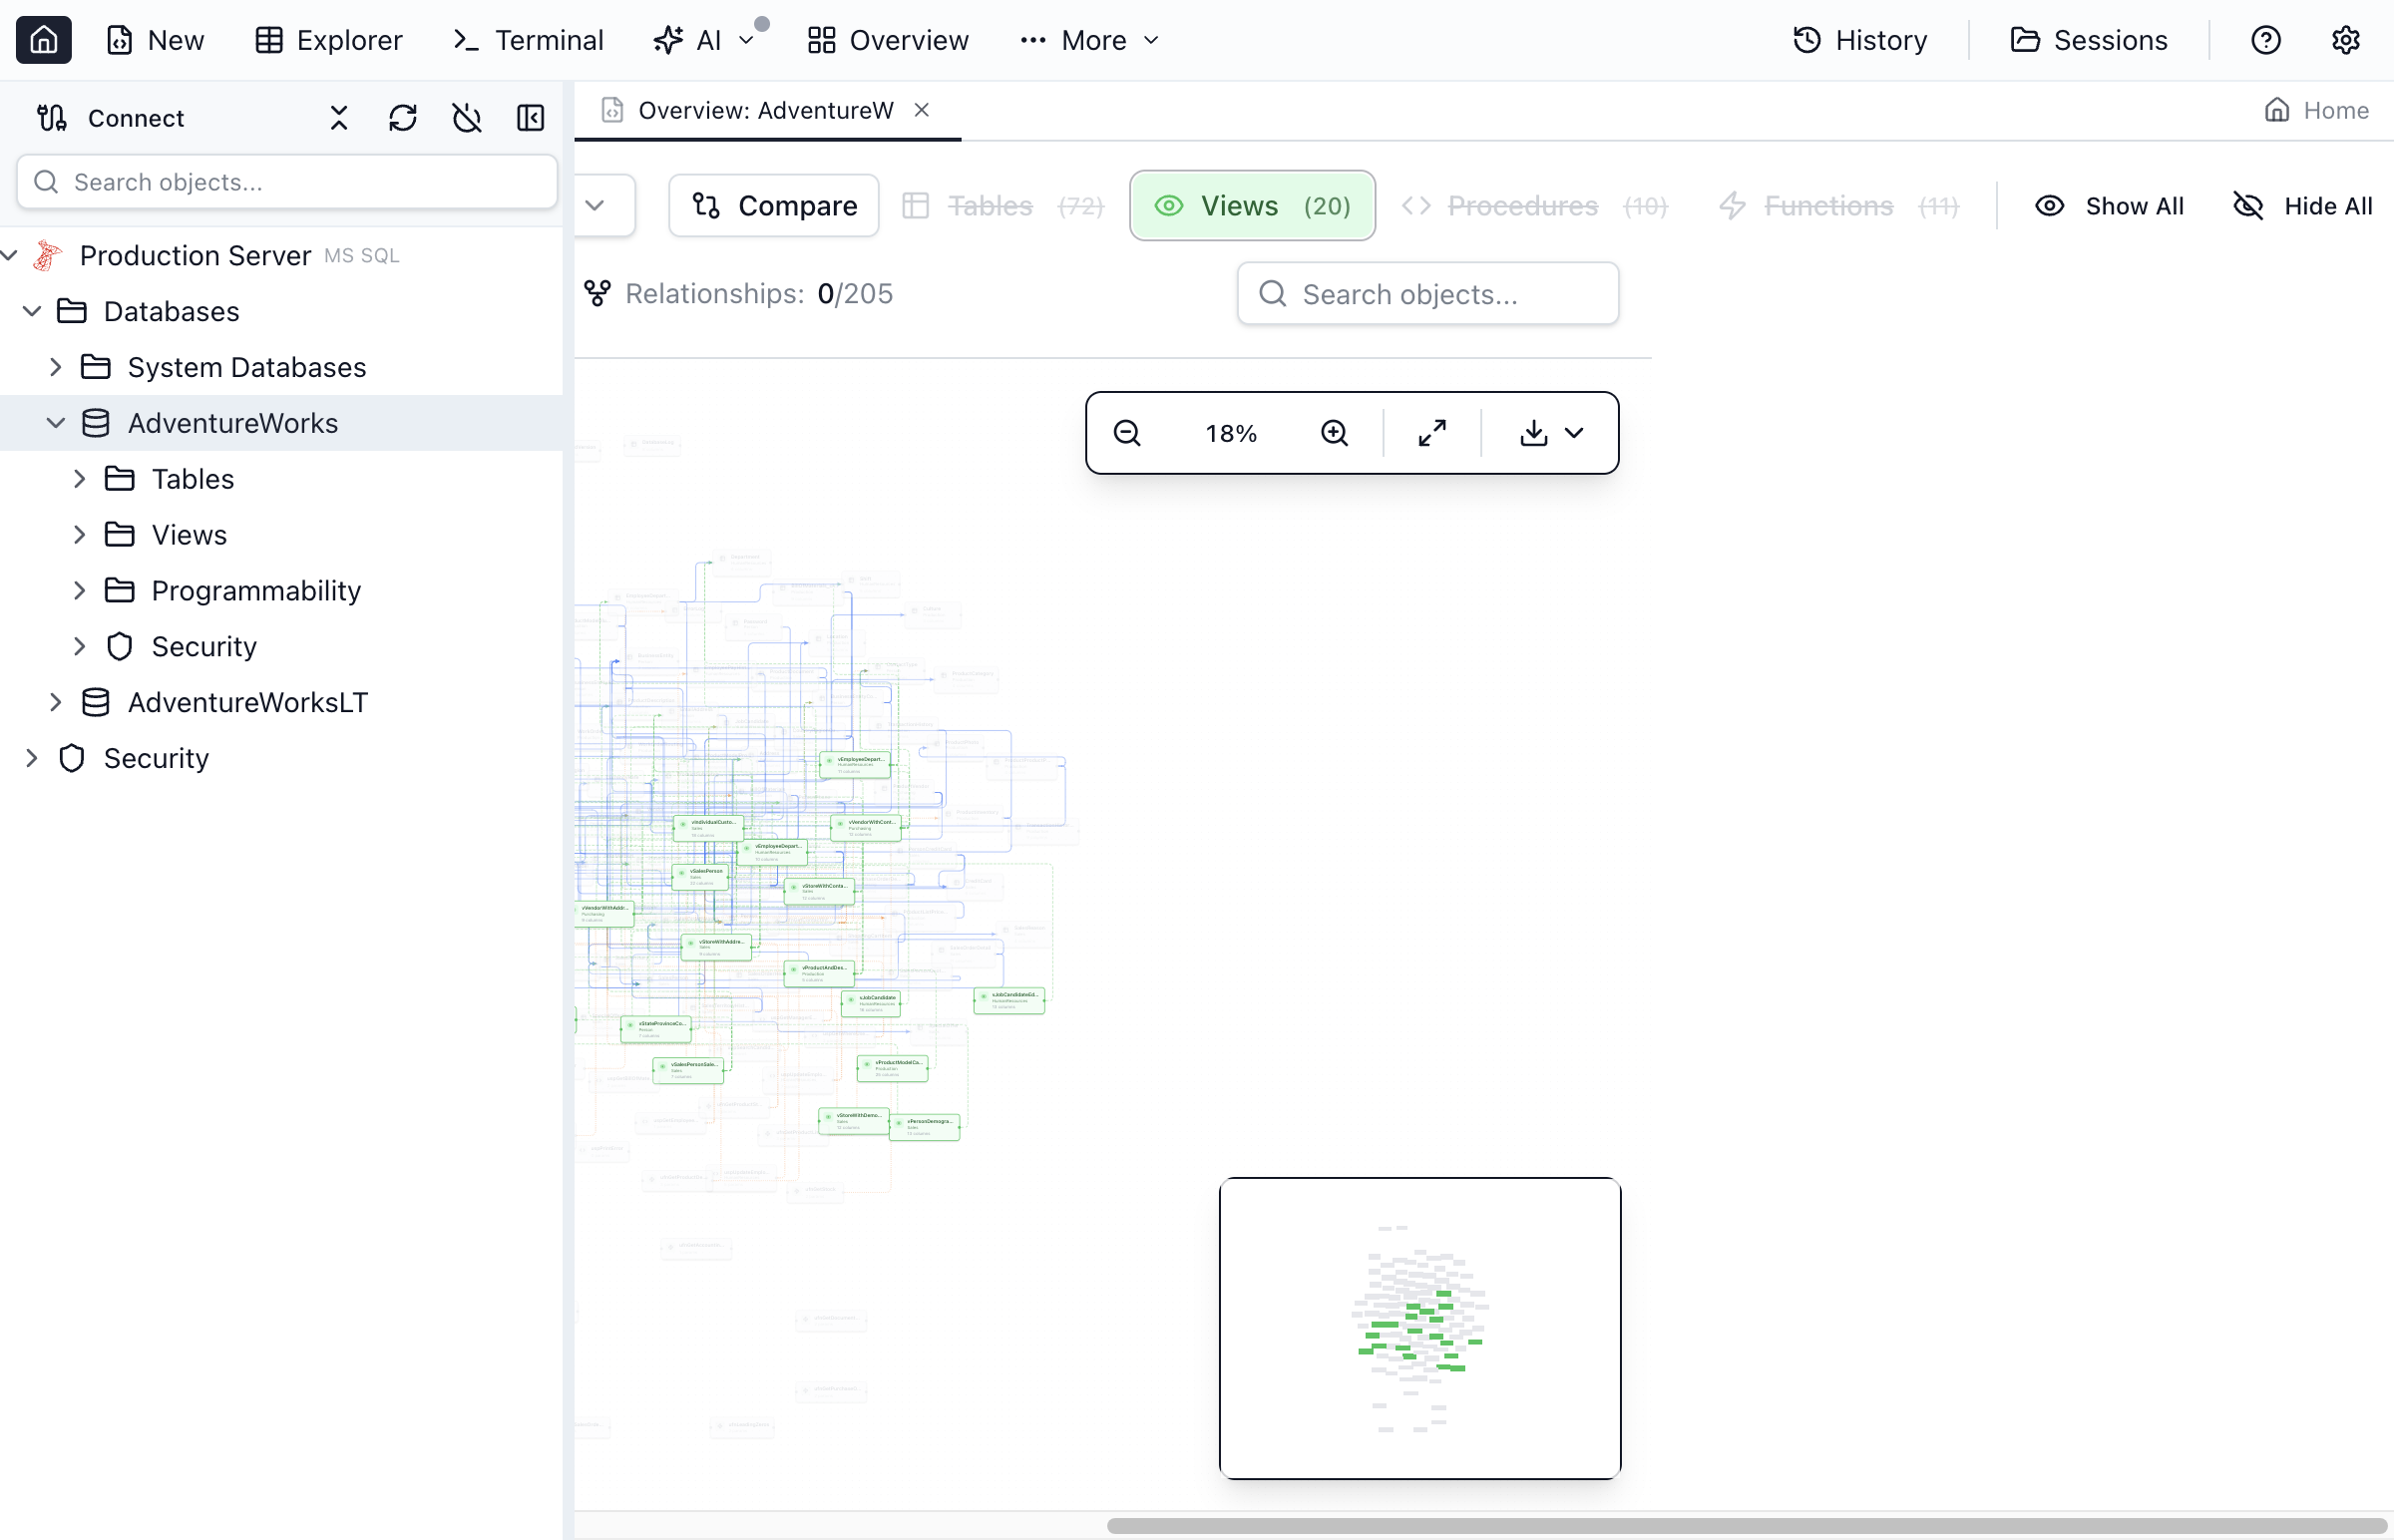
Filter by object type
The stats bar has a toggle chip for each object type — Tables, Views, Procedures, Functions — each showing its count. Switch any of them off to hide that type, and click Reset to show everything again. (These are independent toggles, not a single dropdown, so you can, for example, show tables and views but hide procedures and functions.)
Search objects
- Type in the Search objects box to find objects by name
- Matches are highlighted while non-matches dim
- A counter shows the current match ("N of M"); use the previous/next controls (or Enter / Shift+Enter) to step through matches, centering each one
Schema statistics
The stats bar summarizes the current graph:
- Objects — the total node count (and how many are visible when a type filter is active)
- Relationships — the total edge count across foreign keys, view references, routine references, and loose relationships (visible vs total when filtered)
- Per-type counts — shown on each object-type toggle chip
Exporting the diagram
Export the graph for documentation or sharing from the export menu:
- PNG — a high-resolution raster image (free)
- SVG — vector image that scales without quality loss (Pro)
- PDF — a print-ready document (Pro)
- GraphViz DOT — the graph as DOT source for use in other tooling (Pro)
Exports capture the full diagram, so nothing is cut off at the current viewport.
Pro extras: impact analysis and annotations
Two Pro features build on the graph from the node right-click menu:
- Show Impact Analysis — highlights the objects a change to the selected node would ripple out to
- Add Note / Edit Note — attach an annotation to an object; annotated nodes carry a badge so notes are visible directly on the diagram
Schema Overview vs Dependency Viewer
Both visualize relationships, but at different scope. Schema Overview shows the whole database at once — every table, view, procedure, and function and the edges between them. Dependency Viewer focuses on one object and its immediate Uses / Used By, and lets you step through a chain object by object. Use Schema Overview to learn the shape of a database; use Dependency Viewer to answer "what exactly touches this one object?" before a change.
Tips
- Turn off Procedures and Functions to see the core data model — tables and their foreign keys — on its own
- Use Search to jump to a table in a large schema instead of hunting visually
- Click a table to dim everything except its direct relationships
- Export SVG (Pro) for crisp diagrams in documentation, or PNG for a quick paste into a doc or chat
- Pair it with Schema Compare when you need to document what changed between two databases
Frequently asked questions
What is Schema Overview in Jam SQL Studio?
Schema Overview is an interactive graph of a database's structure — tables, views, stored procedures, and functions as color-coded nodes, connected by arrows for foreign keys, view references, and routine references. It works with SQL Server, PostgreSQL, MySQL/MariaDB, Oracle, and SQLite.
How are foreign key relationships shown in Schema Overview?
Foreign keys are drawn as solid blue arrows pointing from the referencing (child) table to the referenced (parent) table. View references are dashed green and routine references are dotted orange, so the three relationship kinds are easy to tell apart.
Can I filter the diagram to show only tables?
Yes. The stats bar has a toggle chip for each object type — Tables, Views, Procedures, and Functions — so you can switch any of them off to declutter the graph, and a Reset button brings them all back.
How do I find a specific object in a large schema?
Type in the Search objects box to highlight matches and dim the rest; a match counter and previous/next controls step through them and center each hit. Click any node to select it and open its details drawer.
Can I export the schema diagram?
Yes. Export as PNG for free; SVG, PDF, and GraphViz DOT export are available in Pro. The image captures the full diagram at high resolution for documentation or presentations.
Ready to Visualize Your Schema?
Download Jam SQL Studio and see your database structure at a glance.