 Jam SQL Studio
 Published: 2026-08-27
SQL Server Connection Errors We Actually See, and How to Fix Each One
We build a desktop SQL client, and as of August 2026 SQL Server is the most-used engine among Jam SQL Studio users — which means our error telemetry is, in large part, a catalog of the ways SQL Server connections fail in the real world. This post walks through the failures we actually observe, in the shape you actually see them: Login failed for user (18456), pre-login handshake errors, Connection Timeout Expired, the semaphore timeout period has expired, and connection pool exhaustion. For each: what the raw message looks like, what it actually means, the most likely causes ranked by how often we see them, and the concrete fix — server-side and client-side. Plus the story of a pool stall that spent weeks masquerading as a query timeout in our own telemetry.
Once the connection works, a different set of errors takes over: Incorrect syntax near (102), Invalid column name (207), Invalid object name (208) and the rest are ranked in the companion post, the most common SQL Server query errors and how to fix them.
Why a SQL client ended up classifying error messages
Every failed connection in Jam SQL Studio reports an anonymized error category to our telemetry — no hostnames, no SQL, no messages, just a category like auth_failed or conn_refused and a driver code like ELOGIN or 18456. For a long time that taxonomy was embarrassingly coarse: most real-world failures landed in an unknown bucket that told us nothing. So we built a per-engine classifier — signature tables that map the stable phrases in each driver's error messages, plus the structured driver codes when they survive, onto a fixed set of categories. It shipped in version 1.4.23, alongside the user-facing half: failed connections now explain what went wrong in plain language and, where a one-click fix exists, offer it as a button.
Three findings from that work shape this post (qualitative, as of August 2026):
- The top connection-error categories we observe are connection refused, authentication failed, and timeout — in that neighborhood, and consistently ahead of everything else.
- Two of those three — refused and timeout — are routinely confused with each other by the people debugging them, even though they point at opposite problems.
- The raw message is frequently misleading. Drivers wrap certificate failures in generic socket errors, Azure variants wrap database-not-found in a login-failure code, and a pool problem can present as a query timeout. Reading the whole message, not just the headline code, matters.
Here is the SQL Server slice of the classification table, because it doubles as a diagnostic cheat sheet:
| What the message contains | Code | What it actually is |
|---|---|---|
Login failed for user '…' | 18456 / ELOGIN | Authentication failed — server reached, credentials or auth mode rejected |
Cannot open database "…" requested by the login | 4060 | Database missing, offline, or no access for this login — not a credentials problem |
…is not allowed to access the server (Azure) | 40615 | Azure SQL firewall rule missing for your client IP |
connect ECONNREFUSED / connection refused | ECONNREFUSED | Host answered and rejected the port — nothing listening there |
Failed to connect to …:1433 in 15000ms | ETIMEOUT | Nothing answered at all — firewall drop, wrong host, dead VPN |
getaddrinfo ENOTFOUND | ENOTFOUND | DNS — the hostname doesn't resolve from this machine |
Error Locating Server/Instance Specified / SQL Network Interfaces, error: 26 | EINSTLOOKUP | Named-instance lookup failed — SQL Browser unreachable on UDP 1434 |
self signed certificate / certificate chain … not trusted | often wrapped in ESOCKET | TLS certificate not trusted — encryption is on, validation failed |
server requires encryption | EENCRYPT | Server demands TLS the client didn't offer |
socket hang up / ECONNRESET | ECONNRESET | An established connection died mid-conversation |
Now the deep dives, one error at a time.
Login failed for user — Error 18456
Login failed for user 'app_user'. (Microsoft SQL Server, Error: 18456)What it actually means: everything before authentication worked. TCP connected, TLS negotiated, the TDS handshake completed — and then the server looked at your principal and said no. This is the one error in this post where the network is definitively fine. Don't touch the firewall.
The frustrating part is State: 1. SQL Server deliberately hides the real failure reason from unauthenticated clients, so nearly every client-side 18456 reports state 1 no matter what went wrong. The genuine state code is written to the server's ERRORLOG, and reading it there turns guesswork into a lookup:
| State (in ERRORLOG) | Meaning |
|---|---|
| 5 | Login doesn't exist |
| 6 | Windows-style name (DOMAIN\user) used with SQL authentication |
| 7 | Login disabled (and password mismatch) |
| 8 | Wrong password |
| 18 | Password must be changed before first use |
| 38 | Login OK, but its default database is missing or inaccessible |
| 58 | Server is Windows-authentication-only; a SQL login was attempted |
Most likely causes, ranked by what we see:
- The server only allows Windows authentication (state 58). Fresh SQL Server installs default to Windows-auth-only; the first time anyone tries
saor an app login, this fires. Fix: Server Properties → Security → SQL Server and Windows Authentication mode, then restart the service — the setting doesn't apply until you do. - Plain wrong credentials (states 5, 8). Watch for trailing whitespace pasted with a password, and for the wrong login type: a Windows account name with SQL auth selected (state 6) fails even with a correct password.
- The login's default database is gone (state 38, often paired with error 4060). The login is valid; the database it lands in was dropped, renamed, taken offline, or the login lost access. Fix:
ALTER LOGIN [app_user] WITH DEFAULT_DATABASE = [master];then grant access to the intended database withCREATE USER. - Login disabled or locked out (state 7).
ALTER LOGIN [app_user] ENABLE;— and if password policy locked it,ALTER LOGIN [app_user] WITH PASSWORD = '…' UNLOCK;. - Azure SQL auth-mode confusion — a SQL login against a server configured for Entra-only authentication, or vice versa. The Azure variant often surfaces as error 40531 or an 18456 with an Entra-specific state; check which authentication methods the server actually allows.
A first-hand trap from our classifier: some Azure variants (we hit this on Azure SQL Edge) wrap “Cannot open database” — a 4060, a database problem — inside a bare ELOGIN login-failure code. We had to special-case this: our classifier treats ELOGIN as ambiguous and lets the message text override it. The human version of that rule: when you see “login failed,” read the whole message before resetting any passwords. If it mentions a database name, the password was probably fine.
The related error 18452 — “The login is from an untrusted domain and cannot be used with Windows authentication” — is the Windows-auth cousin: the server never even evaluated a principal, because the domain trust or SPN/Kerberos plumbing failed first. That one is fixed in Active Directory (trusts, SPNs, clock skew), not in SQL Server.
Pre-login handshake errors in SQL Server
A connection was successfully established with the server, but then an error
occurred during the pre-login handshake. (provider: SSL Provider, error: 0 -
The certificate chain was issued by an authority that is not trusted.)
What it actually means: the pre-login phase is where client and server negotiate encryption before any credentials are sent. TCP worked — the message says so explicitly — and the failure is in TLS negotiation. Your username and password were never transmitted, so whatever this is, it is not an authentication problem.
In Node.js clients the same failure looks different: the tedious driver wraps certificate distrust inside a generic ESOCKET error whose cause text says self signed certificate or DEPTH_ZERO_SELF_SIGNED_CERT. We learned this the hard way — our classifier has to check the certificate phrase list before trusting the socket-level code, or every self-signed cert on a dev server would be miscounted as a network failure.
Most likely causes, ranked:
- An untrusted (usually self-signed) server certificate. This is the dominant shape we see, and it got dramatically more common because, as of August 2026, current Microsoft client libraries default to encryption on (Microsoft.Data.SqlClient has defaulted
Encrypt=truesince version 4.0, and recent tedious/Node drivers do the same). A SQL Server that was installed without a real certificate presents a self-generated one, and default-on validation rejects it. Connections that “always worked” break the day a driver is upgraded. - TLS version mismatch. Old SQL Server builds (2008–2014 without the TLS 1.2 updates) can't speak the TLS versions modern client OSes require now that TLS 1.0/1.1 are widely disabled. The handshake dies with an unhelpful “connection was forcibly closed by the remote host.”
- A middlebox in the path — TLS-inspecting proxies, some VPN appliances — resetting the handshake it can't parse.
- The thing listening on that port isn't SQL Server. A port-forward to the wrong service produces a pre-login failure because the peer never answers the TDS pre-login packet sensibly.
Fixes:
- The right fix is server-side: install a certificate issued by a CA your clients trust (SQL Server Configuration Manager → Protocols → Certificate), or distribute your internal CA to client trust stores.
- The pragmatic dev fix is client-side: set
TrustServerCertificate=true(encrypted, but unvalidated — acceptable for a dev box, not for production over a network you don't control). - For ancient servers: apply the TLS 1.2 support updates before touching client settings.
In Jam SQL Studio this failure is classified tls_cert_untrusted and the error notice offers a one-click chip: “Retry trusting the server certificate (less secure).” A deliberate design decision behind that wording: the app never silently retries with weakened TLS. The chip states exactly what it changes, you click it, and the setting is kept only if the retry succeeds. We've watched too many tools quietly downgrade security to make a connection dialog look smarter.
Connection Timeout Expired — and how it differs from “connection refused”
Connection Timeout Expired.  The timeout period elapsed while attempting to
consume the pre-login handshake acknowledgement. [...]

-- or, from a Node.js client:
Failed to connect to prod-sql:1433 in 15000ms
What it actually means: the client sent packets and nothing answered within the budget. This is the single most important distinction in connection troubleshooting, and it's the one our telemetry shows people getting backwards — connection-refused and timeout are both in our top three categories, and they point at opposite problems:
Connection refused (ECONNREFUSED) | Connect timeout (ETIMEOUT) | |
|---|---|---|
| What happened on the wire | The host answered with an active rejection (TCP RST) | Packets vanished; no answer of any kind |
| What it tells you | Machine reachable; SQL Server not listening on that port | Path broken: firewall drop, wrong IP, dead VPN, asleep VM |
| Where to look first | The server process and its port config | The network between you and it |
Most likely causes of the timeout shape, ranked:
- A firewall silently dropping the traffic. Corporate and cloud firewalls typically DROP rather than REJECT, which converts “you're blocked” into a slow, ambiguous timeout. Open TCP 1433 (and UDP 1434 for named instances) toward the server.
- Wrong host, dead VPN, or split DNS. The name resolves somewhere unreachable, or resolves differently off-VPN.
Test-NetConnection your-server -Port 1433(Windows) ornc -vz your-server 1433(macOS/Linux) settles reachability in seconds — before you touch any SQL settings. - SQL Server isn't listening on TCP at all. The TCP/IP protocol is disabled out of the box on Developer and Express editions. Enable it in SQL Server Configuration Manager → Network Configuration → Protocols, then restart the service. (If the host is otherwise reachable this usually presents as refused rather than timeout — another reason the distinction matters.)
- The server is genuinely overwhelmed and can't accept the connection in time. Rare in our data compared to the above, but real on saturated boxes.
The named-instance special case: connecting to HOST\INSTANCE requires an extra hop — the client asks the SQL Server Browser service, on UDP 1434, which port the instance is on. If the Browser is stopped or UDP 1434 is blocked, you get “SQL Network Interfaces, error: 26 – Error Locating Server/Instance Specified” (Node clients: EINSTLOOKUP, “Port for INSTANCE not found”). Our classifier gives this its own category — instance_not_found — precisely because the fix is different: start the Browser service and open UDP 1434, or sidestep the lookup entirely by pinning the instance to a static port and connecting to host,port.
One anti-pattern worth naming: raising the connect timeout as a first response. If nothing is answering, 60 seconds of not-answering is not better than 15. Verify the listener with a port test first; raise timeouts only once you've proven the path is merely slow, not closed.
The semaphore timeout period has expired — Windows error 121
TCP Provider, error: 0 - The semaphore timeout period has expired.What it actually means: despite arriving dressed as a SQL Server error, this is Windows OS error 121 (ERROR_SEM_TIMEOUT) bubbling up through the TCP provider. SQL Server never generates it. A low-level network operation — usually on an already established connection — waited on the network stack and gave up. Translation: the network path between you and the server misbehaved mid-conversation.
Most likely causes, ranked:
- An unstable path: Wi-Fi, VPN tunnels, WAN links. If the error correlates with a specific network (office Wi-Fi yes, wired dock no; VPN yes, direct no), you've found it. This is by far the most common shape.
- NIC offload and power-management features misbehaving. Receive Segment Coalescing (RSC), large-send offload, and energy-efficient Ethernet settings have all been implicated in long-transfer stalls on some driver/firmware combinations. Update the NIC driver first; disable these features experimentally, one at a time, only if the error persists.
- MTU mismatch across a tunnel. VPNs shrink the effective MTU; if fragmentation is mishandled, small queries work while large result sets stall and die with error 121. Test with
ping your-server -f -l 1472and step down until it passes. - Cloud/gateway idle disconnects. Long-idle connections through Azure gateways or stateful firewalls get dropped silently; the next use fails. Keepalives and retry logic are the mitigation.
Fixes: this one is fixed in the network layer, not in SQL Server — there is no server-side setting for it. Reproduce on a wired connection without VPN to isolate the path; update NIC drivers; check MTU across tunnels; and treat it as transient in application code (retry with backoff). If it happens right after a laptop wakes from sleep, keep reading — the last two sections are about exactly that failure family.
SQL Server connection pool exhausted: “max pool size was reached”
Timeout expired.  The timeout period elapsed prior to obtaining a connection
from the pool.  This may have occurred because all pooled connections were in
use and max pool size was reached.

-- or, from the node-mssql / tarn pool, far less helpfully:
TimeoutError: operation timed out for an unknown reason
What it actually means: this error is client-side. The connection pool lives in your application process, and the pool's acquire step — “hand me a connection” — couldn't complete before its own timeout. The SQL Server on the other end may be completely idle while this fires. Restarting the server won't help; it isn't involved.
Most likely causes, ranked:
- Leaked connections. Code paths that open a connection and never dispose it — a missing
using/finally, an early return, an exception path. The pool fills with zombies until the cap (ADO.NET defaults to 100; node-mssql to 10) and every new request waits, then fails. The tell: exhaustion that builds up over hours and resets when the app restarts. - Long transactions and slow queries holding connections. Nothing is leaked, but ten 5-minute report queries hold ten connections for five minutes, and the eleventh caller times out. The tell: exhaustion that correlates with specific workloads and recovers on its own.
- Genuine burst concurrency above the pool size. The rarest cause in our experience, and the only one where raising
Max Pool Sizeis the right answer. Raising it in response to causes 1 or 2 just delays the same failure and hides the bug. - Nothing is busy at all — dead idle connections are wedging the acquire. The pool reports a timeout obtaining a connection, users read “all pooled connections in use,” but the free list is full of connections whose peer silently vanished. This is the sneaky one, it disproportionately hits laptops and VPNs, and it's the subject of the next section.
Fixes: instrument before you tune. Log pool counters (in .NET, the NumberOfActiveConnections/pool performance counters; in Node pools, borrowed/free/pending counts) at the moment of failure. Borrowed = max, pending > 0 is true exhaustion — go find the leak or the long transaction. Free > 0 while acquires still time out is not exhaustion at all — it's dead connections, and no amount of pool-size tuning fixes it.
A stall that looks like a timeout — how we learned to tell them apart
This is the war story, and the reason the previous section has a cause #4.
Over a 30-day window, our telemetry showed a cluster of query-timeout events that was 100% SQL Server — no other engine contributed a single event. Stranger: the timeout events carried a stage marker, and roughly three out of four fired at the pool-acquire stage, not while any query was executing. Users experienced it as “my query timed out” and the UI (ours included, at the time) implied all pooled connections were busy. Nothing was busy.
The root cause took a while to earn, because every individual piece was behaving as documented:
- The
mssqldriver validates every pooled connection on checkout by running aSELECT 1probe on it. Reasonable. - That probe runs under the connection's request timeout — which our pools deliberately set to
requestTimeout: 0(unlimited), because we bound every real query with an explicit per-call timeout instead. Also reasonable. - Put together: the validation probe was unbounded. Nobody chose that; it emerged from two sensible decisions.
Now add a laptop. Sleep/resume, a VPN drop, or NAT idle eviction leaves pooled connections half-open: the socket looks perfectly fine locally, but the peer is gone and will never say so. The SELECT 1 probe's bytes go into TCP retransmission — which keeps trying for minutes — the probe never returns, and the pool's acquire wedges until the pool-level acquire timeout (30 seconds in our stack) kills it. Every stale idle connection converted into one 30-second, user-visible “timeout.” A post-resume burst of activity converted several at once. The error message blamed busy connections; the free list was the problem.
We reproduced it faithfully before fixing it: a local TCP proxy in front of a real SQL Server, flipped mid-test to black-hole existing sockets (keep them open, swallow all bytes — a faithful half-open peer) while allowing new connections. The stock configuration failed the post-“resume” query at just over 30 seconds with the exact production error signature. With the fix, the same scenario succeeded in about 10.
The fix shipped in Jam SQL Studio 1.4.23 and is almost embarrassingly small: a hard 10-second deadline on the validation probe. A probe that hasn't answered in 10 seconds is treated as failed, the dead connection is destroyed, and the acquire proceeds to a fresh connection well inside its budget. Same probe, same meaning — only the previously-infinite wait is bounded. The user-visible effect: queries that used to hang for 30 seconds after a laptop woke up now recover in seconds.
How to tell a stall from a timeout in your own stack — the checklist we wish we'd had:
- The failure duration is suspiciously exact. Real query timeouts vary with the query; a stall fails at precisely the pool's acquire timeout (30 s in tarn's default, 15 s in ADO.NET's default connect budget), every time.
- Failures cluster right after sleep, resume, or VPN reconnect. A genuine slow-query problem doesn't care when your laptop woke up.
- The server shows nothing. No long-running requests, no blocking, no load spike at the failure timestamps. The server never saw the probe.
- Pool counters contradict the message. Free connections available while acquisition times out means dead connections, not exhaustion.
And the generalized fix, whatever your stack: bound every validation probe, make sure idle connections are reaped aggressively after suspend, and add retry-once-on-first-failure logic for the connection that was checked out across a sleep (in ADO.NET, ConnectRetryCount plus clearing the pool on the first post-resume failure covers most of it).
What the app does with all this
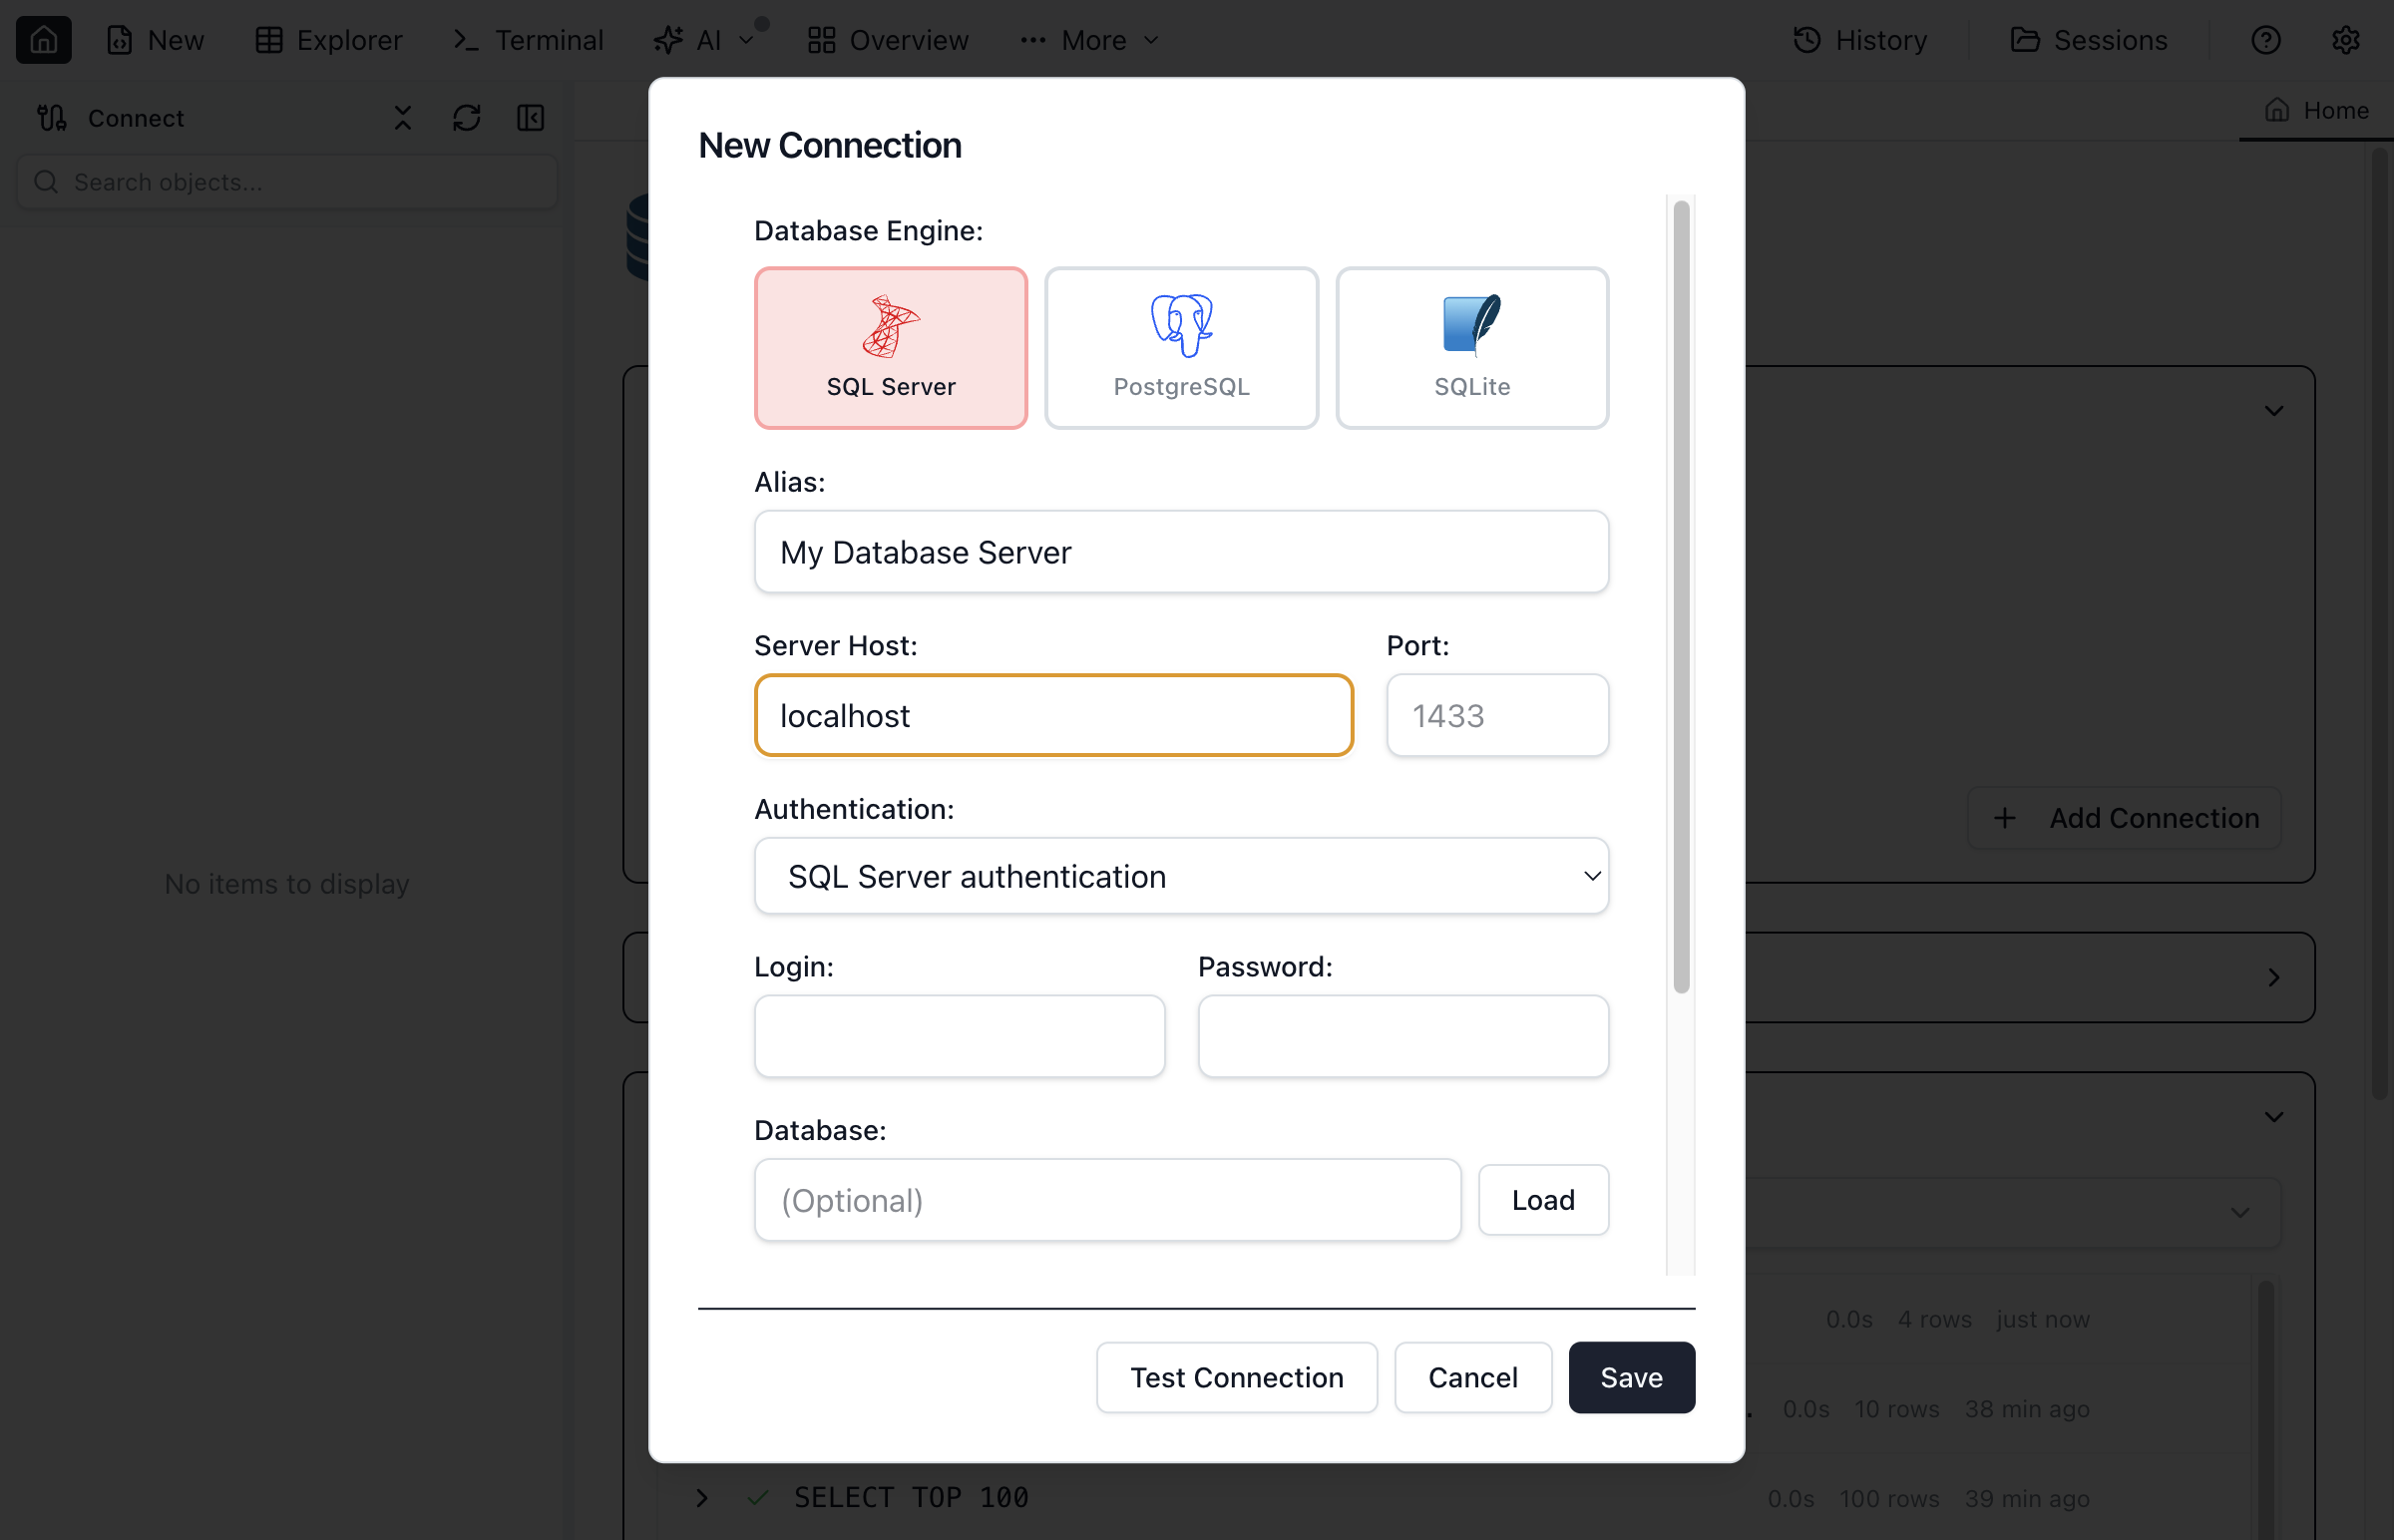
Everything above is encoded in Jam SQL Studio 1.4.23. A failed connection is classified per-engine, the notice explains the failure in the terms of this post (“server certificate not trusted,” not ESOCKET), the raw driver text stays one click away under Error details, and where a safe one-click fix exists — retry trusting the certificate, retry with encryption enabled — it's a button that states its trade-off. Query errors got the same treatment with inline tips for common causes. And the pool fix means the post-sleep stall described above is handled inside the app: stale connections are detected and replaced within seconds. The connections guide covers the dialog end to end.
Quick Answers
Short answers to the questions this post covers.
Q: What does “Login failed for user, Error 18456, State 1” mean?
A: State 1 is deliberate: SQL Server hides the real failure reason from unauthenticated clients, so almost every client sees State 1 regardless of the cause. The real state code is written to the server's ERRORLOG. The most common real causes are: the server is in Windows-authentication-only mode and rejected a SQL login (state 58), the password is wrong (state 8), or the login's default database is missing or inaccessible (state 38).
Q: How do I tell whether SQL Server is down or a firewall is blocking me?
A: By the error shape. “Connection refused” (ECONNREFUSED) means the host answered and actively rejected the port — the machine is reachable but SQL Server isn't listening there (service stopped, wrong port, or the TCP/IP protocol is disabled). A connect timeout means packets disappeared without any answer — typically a firewall silently dropping traffic, a wrong IP, a VPN that isn't up, or a paused/asleep VM. Refused points at the server process; timeout points at the network path.
Q: Is “the semaphore timeout period has expired” a SQL Server bug?
A: No. It's Windows OS error 121 (ERROR_SEM_TIMEOUT) surfacing through the TCP provider — SQL Server never generates it. It means a low-level network wait gave up mid-conversation. Look at the network path, not the database: Wi-Fi or VPN instability, NIC offload/power-management features, MTU mismatches across tunnels, or cloud gateways dropping long-idle connections.
Q: Is SQL Server connection pool exhaustion a server-side problem?
A: Almost never. The connection pool lives in your application, and “max pool size was reached” means your own code is holding connections — usually leaked (never-disposed) connections or long-running transactions. The server can be completely idle while your pool is exhausted. One sneaky exception: dead idle connections in the pool can make acquisition itself hang, which looks like exhaustion but isn't — nothing is actually busy.
Q: Why do my SQL Server queries hang for exactly 30 seconds after my laptop sleeps?
A: Sleep or a VPN drop leaves pooled connections half-open: the socket looks fine locally, but the peer is gone. If the pool validates connections on checkout with a probe query and that probe has no timeout, the probe's bytes go into TCP retransmission and the acquire hangs until the pool's own acquire timeout — commonly 30 seconds — then fails. The fix is to put a hard deadline on validation so dead connections are destroyed and replaced in seconds; Jam SQL Studio shipped exactly this fix in version 1.4.23.
The takeaway
Every error in this post carries more diagnostic information than it appears to — if you know which layer produced it. 18456 means the network is fine; a pre-login failure means your credentials were never sent; refused and timeout point in opposite directions; error 121 was never SQL Server's to begin with; and “pool exhausted” can mean the opposite of what it says. That last lesson cost us weeks of telemetry archaeology, which is exactly why we now classify these errors per-engine and put the conclusion — not the raw driver dump — in front of the user.
Connection Errors, Explained in the Dialog
Jam SQL Studio classifies failed SQL Server, PostgreSQL, MySQL, Oracle, and SQLite connections, explains the cause, and offers one-click fixes. Free for personal use.