 Jam SQL Studio
 Query Application Insights & Azure Monitor Logs
Jam SQL Studio is a desktop KQL query tool for Application Insights and Azure Monitor / Log Analytics. Both expose an Azure Data Explorer query proxy, so you connect and run the same KQL you would in the Azure Portal's Logs blade — with schema-aware IntelliSense, a read-only table browser, and | render charts — from a desktop app on Mac, Windows, and Linux.
Free for personal use • No account required • Mac, Windows, Linux • Last updated September 2026
Connect your telemetry
Application Insights and Azure Monitor both speak the Azure Data Explorer query protocol.
Application Insights (component proxy)
An Application Insights component exposes a query proxy at https://ade.applicationinsights.io/subscriptions/…. Add a connection, choose Azure Data Explorer as the engine, and paste the proxy URL — the component becomes a single database you query with KQL. Sign in with the resource's own Microsoft Entra ID tenant. Don't want to hunt for the URL? Click Browse Azure and pick the component from your signed-in account.
Azure Monitor / Log Analytics (workspace proxy)
A Log Analytics workspace — the store behind Azure Monitor Logs — exposes its proxy at https://ade.loganalytics.io/subscriptions/…. It connects exactly like the component proxy: one database named after the workspace, KQL queries, Entra sign-in. Tables like AzureActivity, Heartbeat, or your custom logs show up in the object explorer.
.show commands.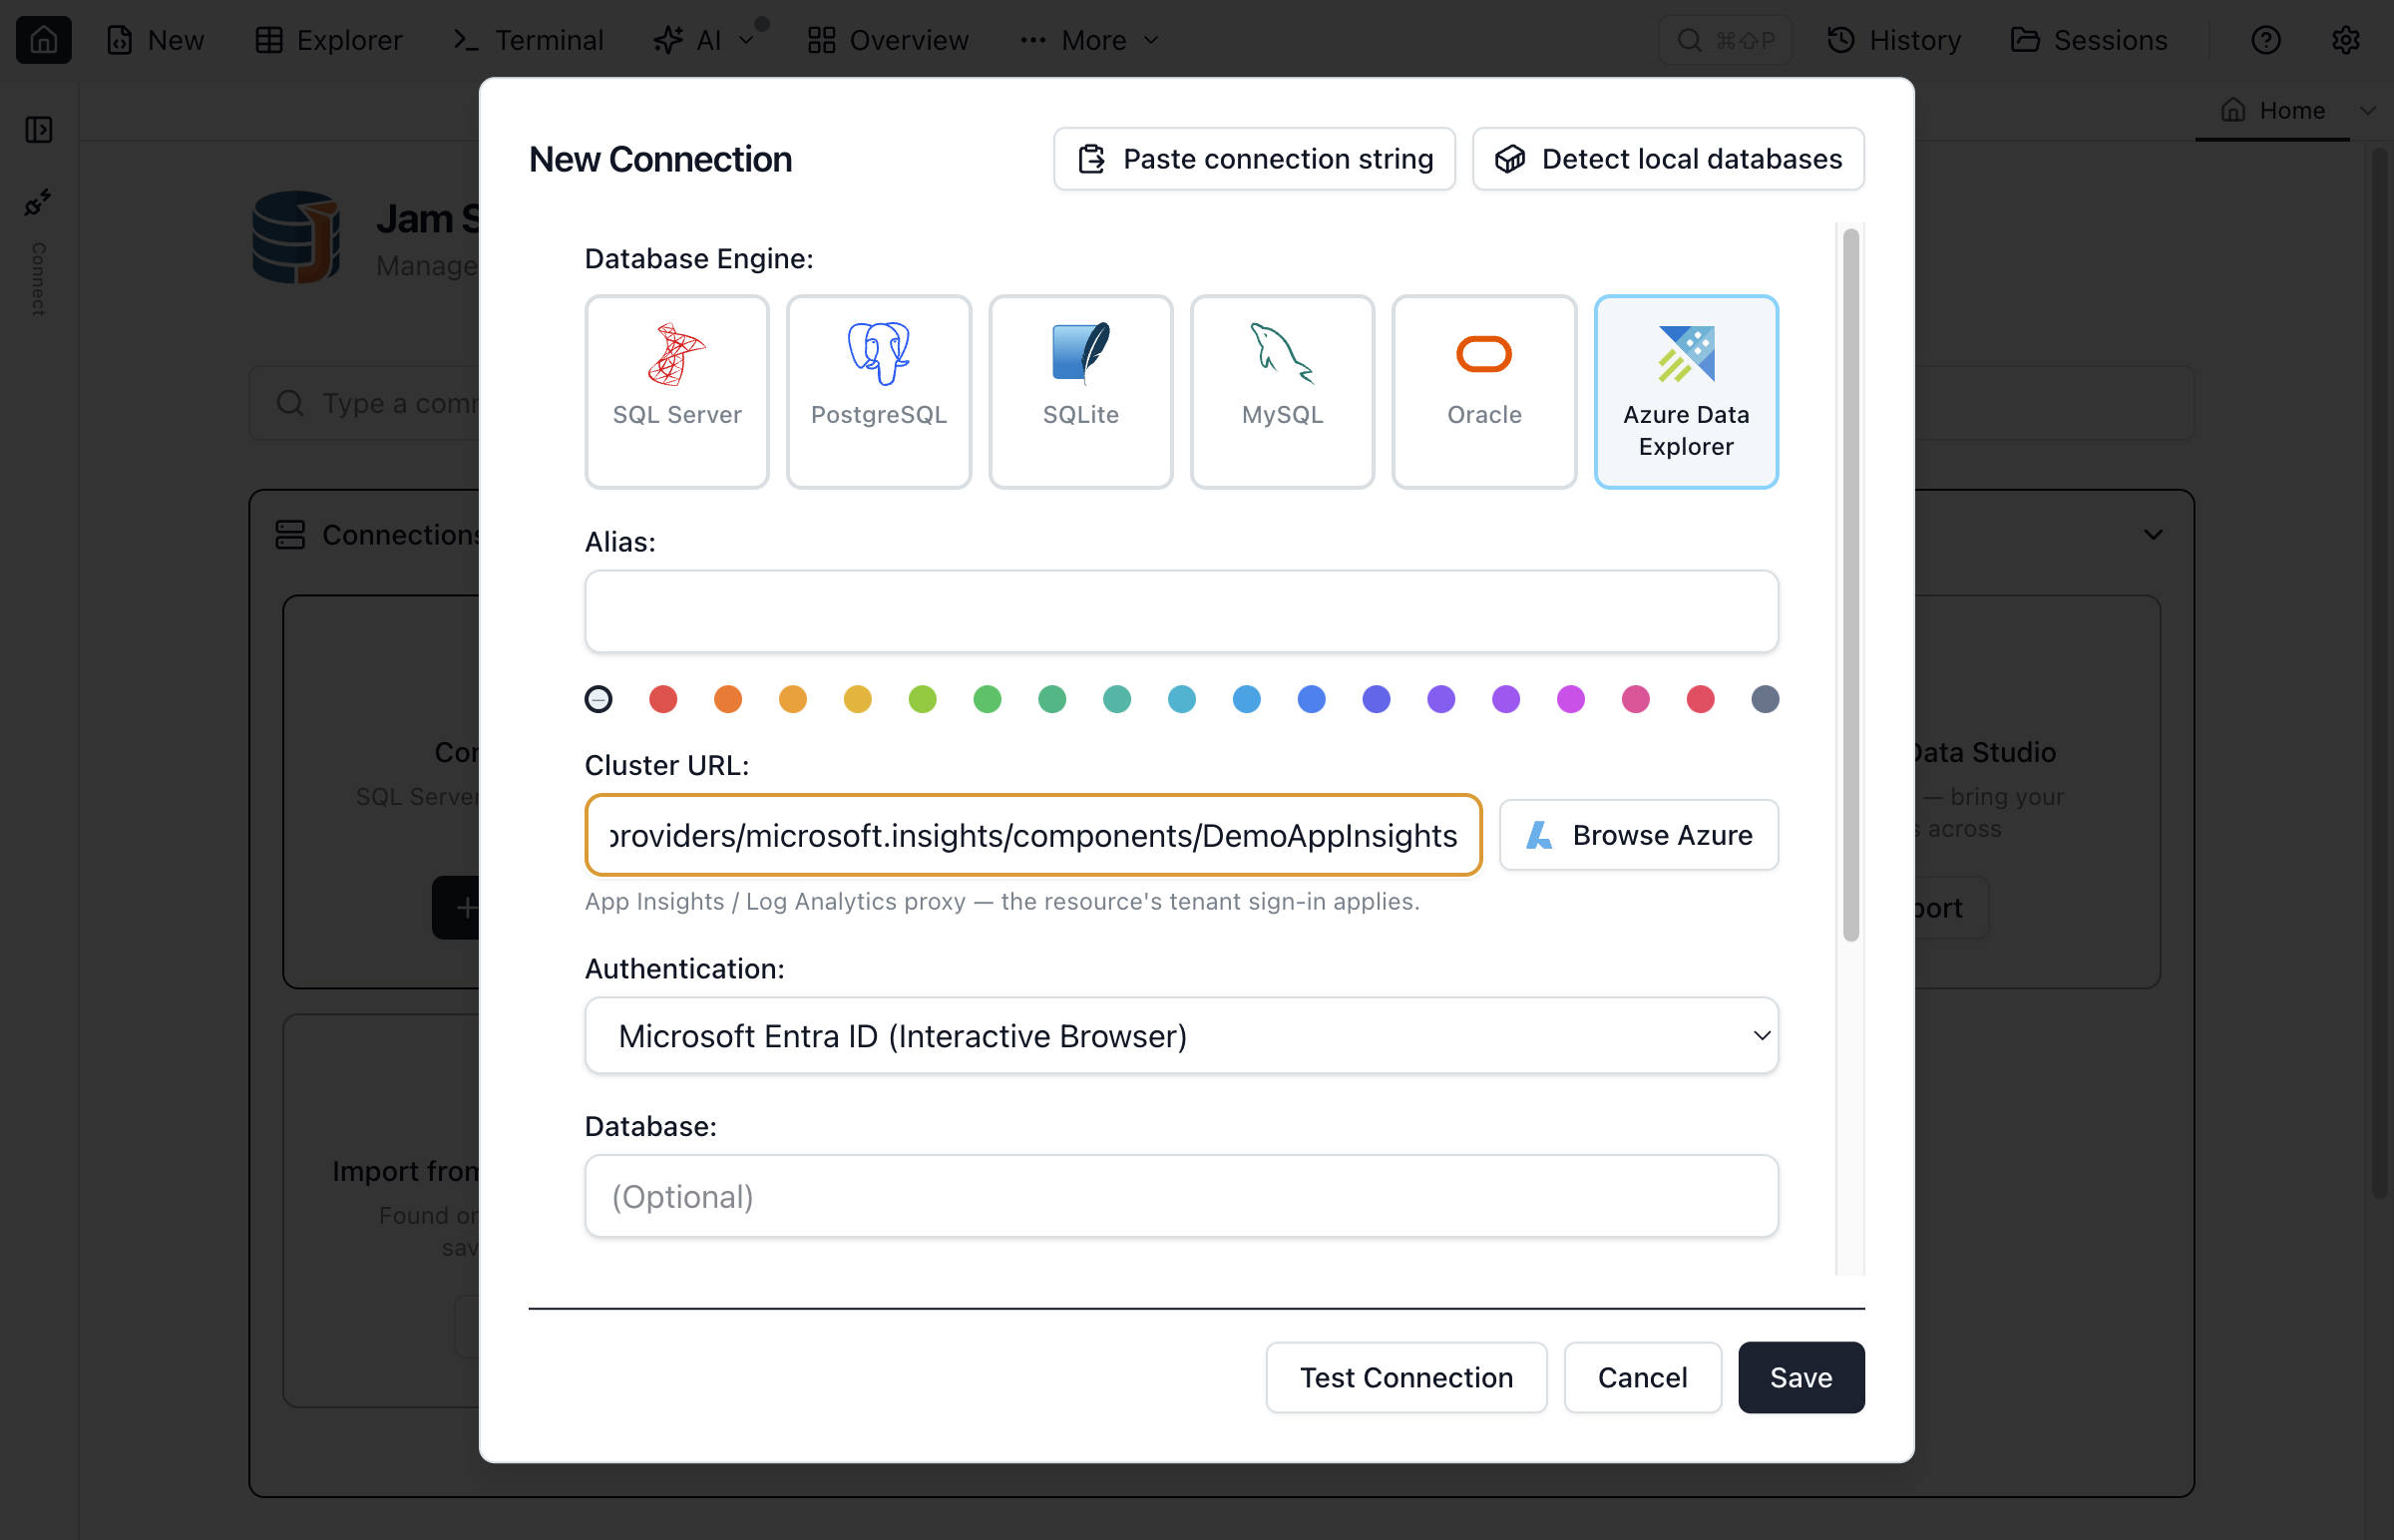
ade.* proxy URL — the form recognises it and applies the resource's tenant sign-in.Write KQL with IntelliSense
The editor uses Microsoft's Kusto language service, fed with your resource's schema, so you get schema-aware completions, hover, and signature help for tables, columns, functions, and operators. Statements are separated by a blank line, and each returns its own result set. Cancel a long-running query from the toolbar; cancellation is sent server-side.
Slice a telemetry table without retyping KQL
Read-only doesn't mean typing raw KQL for every filter.
- Enum columns. Columns like
severityLevel,cloud_RoleName, or result code get a value-picker chip — Jam SQL Studio samples the distinct values and emits| where Column in (…), so you filter without retyping the KQL. - JSON columns. Telemetry lives in
dynamiccolumns likecustomDimensionsandcustomMeasurements. Jam SQL Studio treats them as structured JSON: peek the shape and filter by path —| where customDimensions.tenant == "acme"— from a chip. - Loose foreign keys. Declare a logical link (for example
operation_Idacross request and dependency tables) and jump from one row to its related rows read-only, no hand-written join.
The column names above are the classic Application Insights schema that the ade.applicationinsights.io proxy exposes; in a Log Analytics workspace the same telemetry lives in tables such as AppRequests and AppDependencies, and the chips work the same way there. All three are declared in the per-database MetaInfo layer and are exportable, so you can share your telemetry-filtering setup with your team.
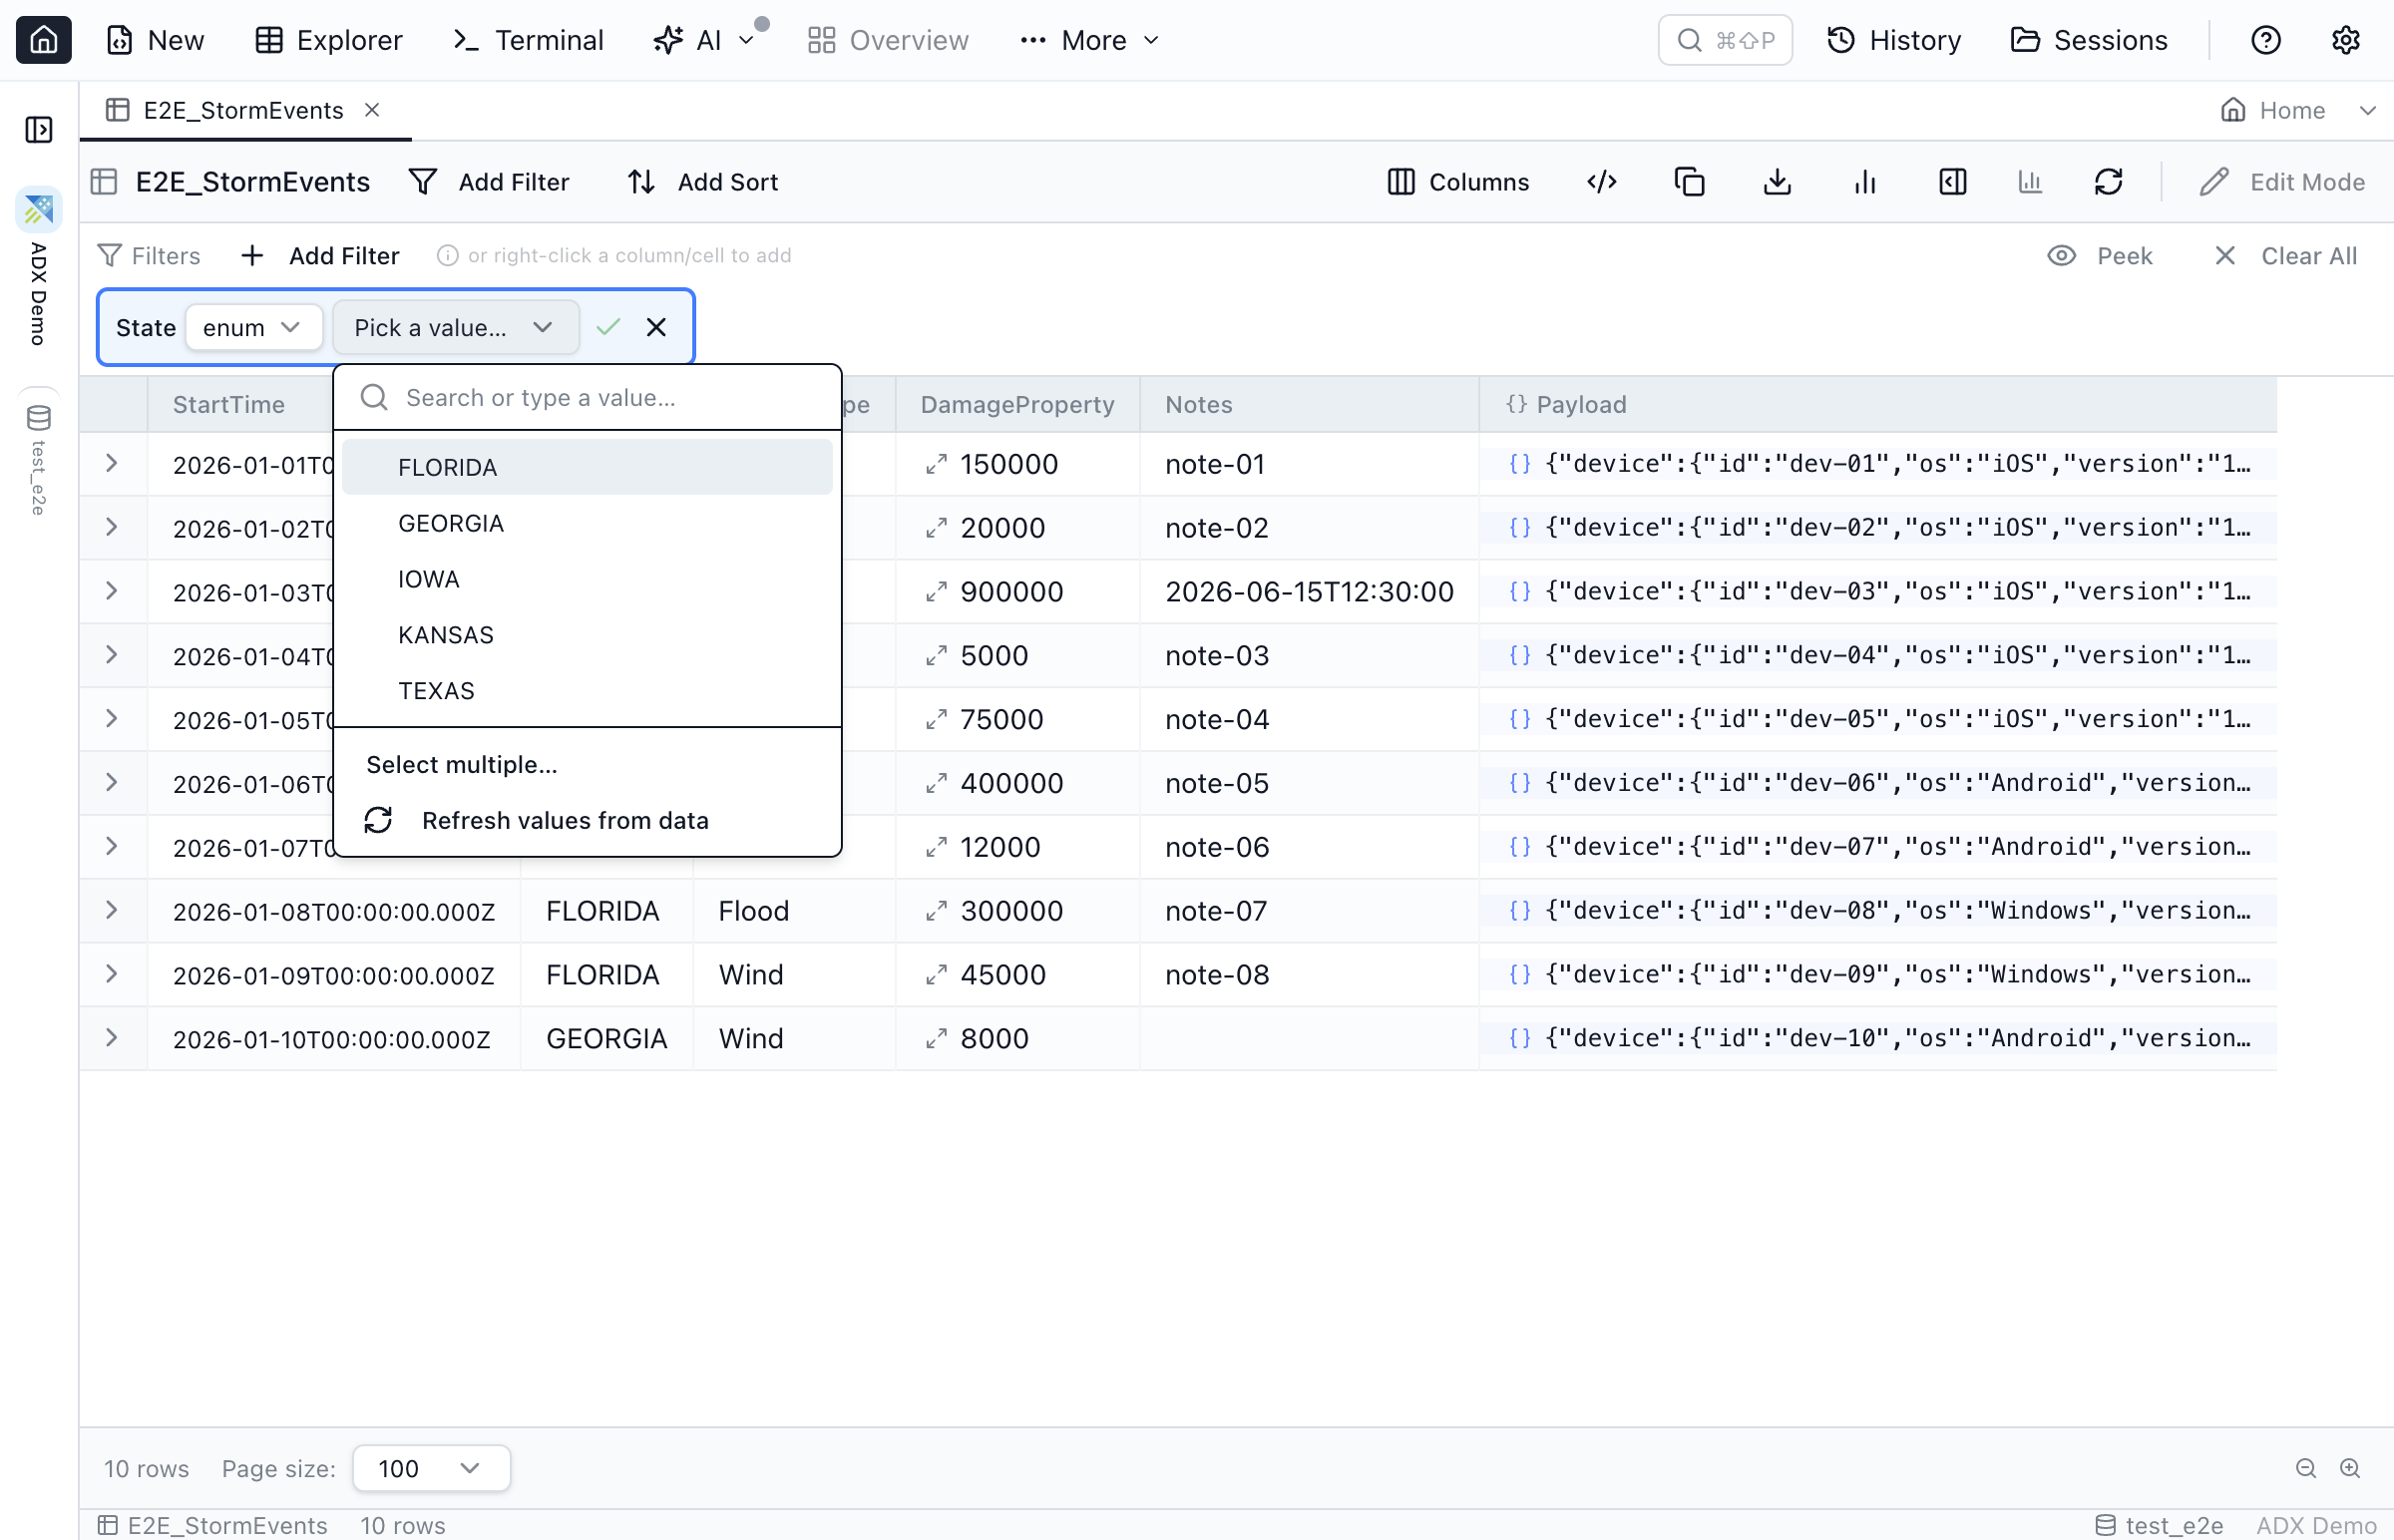
| where clauses.Charts from | render
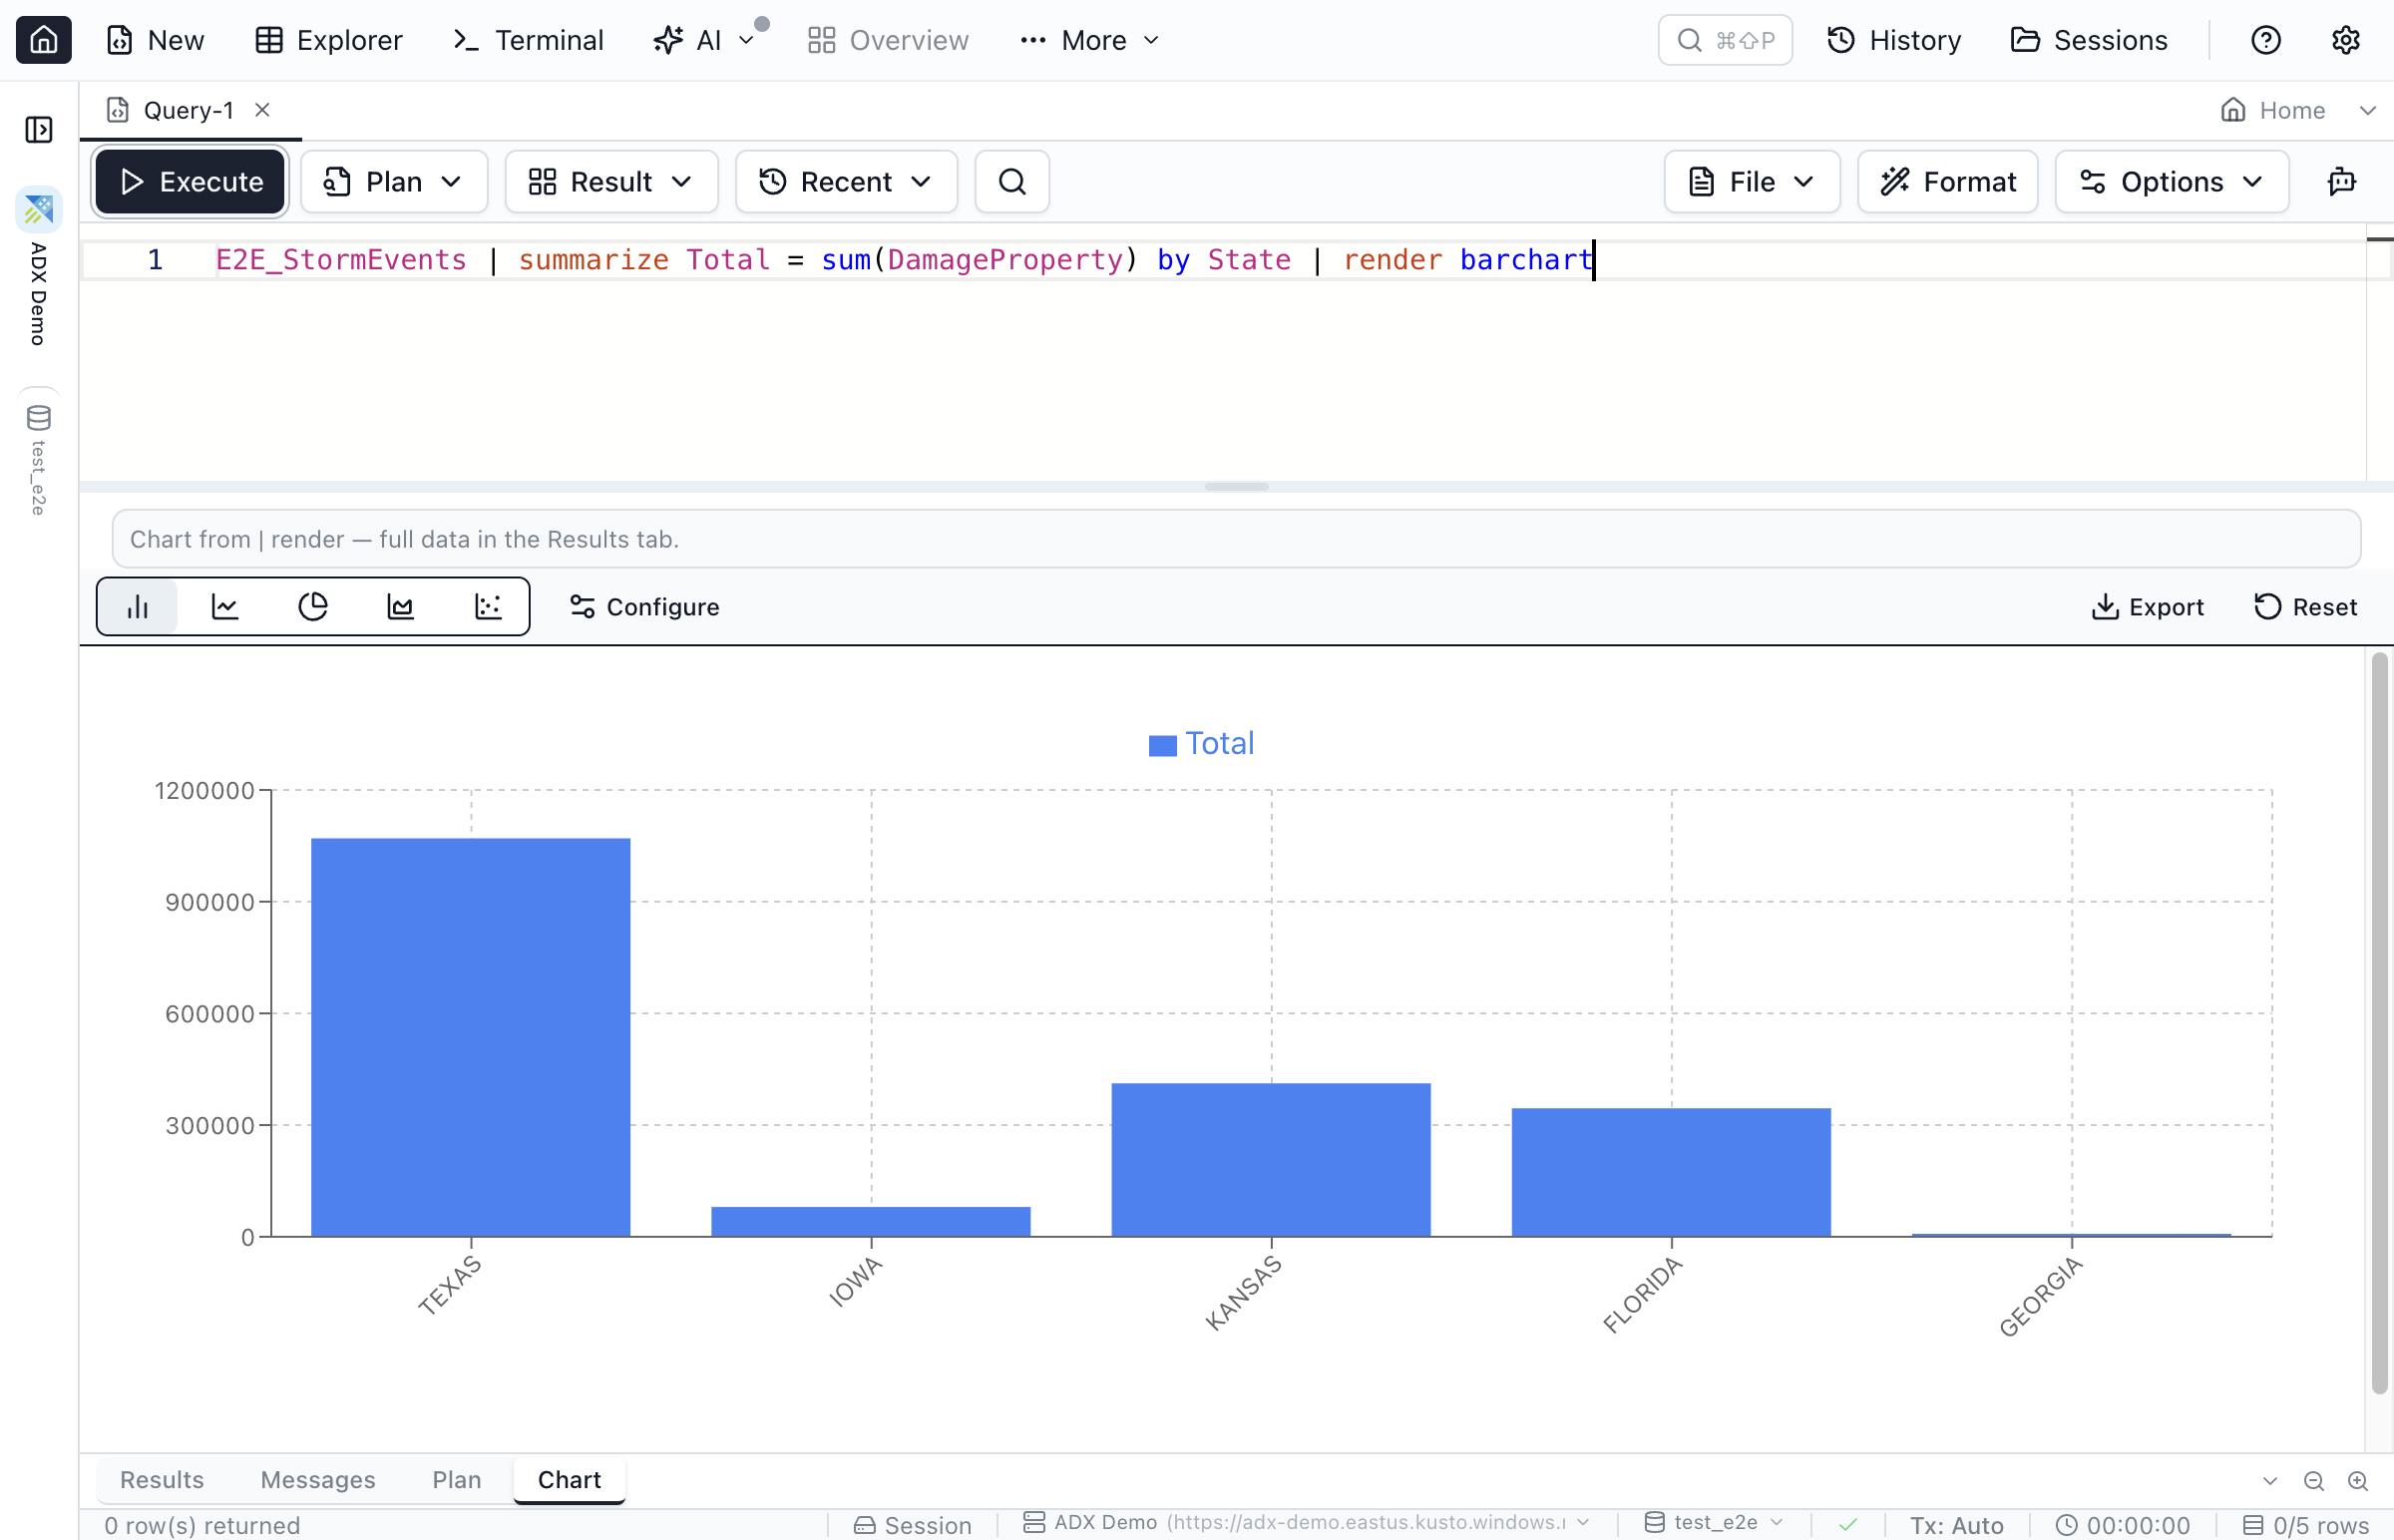
When a KQL result carries a | render hint (timechart, barchart, piechart, and friends), Jam SQL Studio builds the matching chart automatically and opens the Chart tab — ideal for turning an Application Insights requests-over-time query into a line chart without leaving the app.
Desktop KQL tool vs the Azure Portal Logs blade
What you gain over the in-browser query experience.
| Feature | Jam SQL Studio | Azure Portal Logs | Kusto.Explorer |
|---|---|---|---|
| Standalone desktop app (Mac / Win / Linux) | ✓ | ✗ In-browser | Windows only |
| Application Insights | ✓ Paste URL or Browse Azure | ✓ | ✓ Manual proxy URL (Windows) |
| Azure Monitor / Log Analytics | ✓ Paste URL or Browse Azure | ✓ | ✓ Manual proxy URL (Windows) |
| Filter without writing KQL | ✓ Enum value pickers, JSON-path and loose-FK chips | Simple mode: point-and-click column filters with a value list | ✗ |
| Query your SQL databases in the same app | ✓ | ✗ | ✗ |
| AI agents via local MCP server | ✓ | ✗ | ✗ |
| Cost of the tool | ✓ Free for personal use; Pro for commercial use | ✓ Included in the Azure portal | ✓ Free |
Microsoft documents connecting Kusto tools to Application Insights and Log Analytics through the same ade.* query proxies, so Kusto.Explorer reaches them too — on Windows, with a hand-assembled proxy URL. Microsoft's Kusto Explorer extension for VS Code (1.0 in June 2026) adds cross-platform KQL editing inside the code editor, though as of September 2026 its docs don't cover these proxies. Whichever tool sends the query, Azure Monitor charges interactive queries on Basic and Auxiliary logs per GB scanned; interactive queries on Analytics-plan tables aren't charged by data scanned.
Read-only by design
Jam SQL Studio treats Application Insights and Azure Monitor connections as read-only: no row editing, no ingestion, and only queries and .show commands run. Management commands (.create, .drop, .ingest) are not supported. Telemetry is something you query rather than edit, so this covers the analytics workflow this page is about.
Frequently Asked Questions
How do I query Application Insights outside the Azure Portal?
Application Insights exposes an Azure Data Explorer query proxy at ade.applicationinsights.io. Jam SQL Studio connects to that proxy as a Kusto connection, so you run the same KQL you would in the Portal's Logs blade — with schema-aware IntelliSense, a read-only table browser, and | render charts — from a standalone desktop app on Mac, Windows, or Linux.
Can I run KQL against Azure Monitor and Log Analytics from the desktop?
Yes. Azure Monitor Logs and Log Analytics workspaces expose a query proxy at ade.loganalytics.io. Jam SQL Studio connects to it the same way as an Azure Data Explorer cluster; the workspace appears as a single database you can query with KQL. Use Browse Azure to pick the workspace from your signed-in Azure account.
Is there a free Application Insights query tool for Mac?
Yes. Jam SQL Studio is free for personal use and runs on macOS (Apple Silicon and Intel), Windows, and Linux. It connects to Application Insights and Azure Monitor via their Azure Data Explorer query proxies with Microsoft Entra ID sign-in, and needs no Kusto.Explorer (which is Windows-only). See the Kusto Explorer alternative page.
Can I edit or ingest telemetry data?
No. Jam SQL Studio treats Application Insights and Azure Monitor connections as read-only: you query and browse, but there is no row editing and no ingestion, and only queries and .show commands run. Deleting telemetry, such as a Log Analytics purge, stays in the Azure portal or API.
A desktop KQL tool for your telemetry
Query Application Insights and Azure Monitor with IntelliSense and charts — free for personal use, on Mac, Windows, and Linux.